incorrect representation of mixed rgb and rgba colors in mesh3d
Nobody has claimed this yet.
- Dominant language
- Python
- Stars
- 18.8k
- Forks
- 2.8k
- Avg merge
- 16h 26m
- Merged PRs (30d)
- 21
Description
Hi folks!
I encountered some unexpected behavior in Mesh3d. I hope you could have a look. It is hard for me to judge if these are issues, here or upstream, or I am missing something.
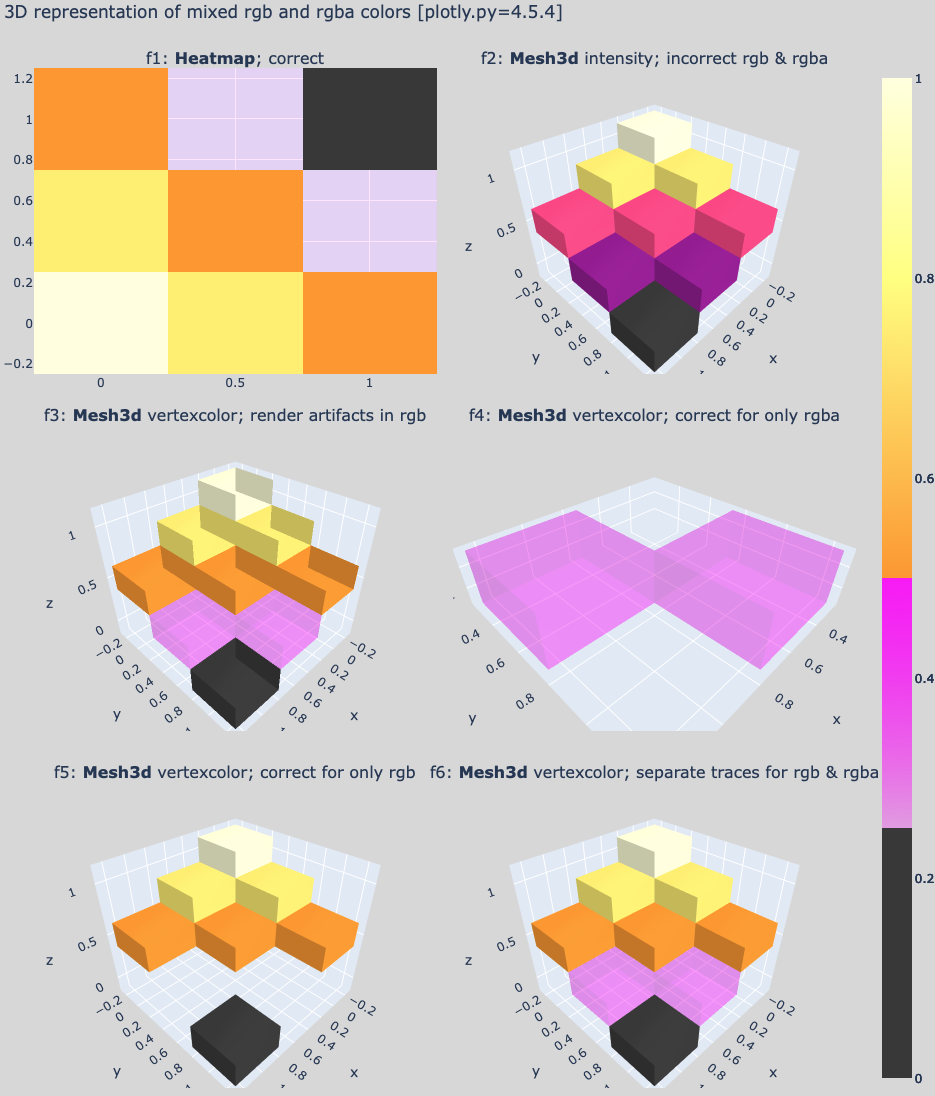
-
Incorrect colors in plots with
intensityand a discontinuouscolorscale(see panel f2).
a) Colors with opacity (rgba) are shown without opacity (rgb). This issue was reported before.
b) Discontinuous transitions in thecolorscaleappear to be ignored. As a result, colors are introduced that are not found in the colorscale. In the example, panel f2: purple = black + magenta, raspberry = magenta + orange.
c) I would expect the same colorscale behavior as in 'scatter' or 'heatmap' (panel f1). -
Render artifacts occur for
facecolororvertexcolorsurfaces, when rgb and rgba colors are put in the same trace (see panel f3).
a) Surfaces do look opaque when only rgb colors are present (panel f5).
b) A partial workaround was to plot rgb and rgba vertices in separate traces (panel f6). Not sure what to do when vertices have a gradient between rgb and rgba... -
An additional trace is needed to add a colorbar when
facecolororvertexcoloris used instead ofintensity.
a) I do expect the colorbar to be dropped when colors are hardcoded. But the workaround to add a customcolorbarorcoloraxiswith a 'hidden' trace may not be obvious to everyone. Add an example to the documentation? -
The rgba colors in the
colorbarappear mixed with layoutpaper_bgcolor, effectively the transparent magenta colors are too dark in the Working Example.
a) Can acolorbarbackground be set to match the (default) plot background color? -
The image above is a screenshot and differs from the exported image, using
f7.write_image(...)after the Working Example below.
a) In my exported copy, some of the layoutsceneaxes appeared 'ghost'-duplicated into the next subplot. Only visible if the scene axes (ranges) change between subplots. Issue on my system or in Orca?
Screenshot 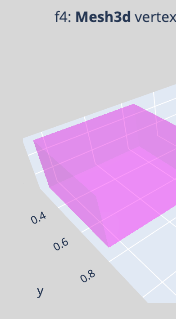 vs Orca[1.3.0]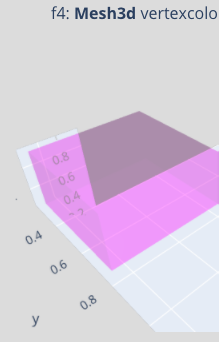
Finally, for a large number of shapes (or animations) I noticed significant performance loss in looking up and hardcoding the colors of vertices. Ideally, I would get the intensity method of Mesh3d to give me the expected result (more like f6, less like f2). Any ideas? Your advise is appreciated!
import numpy as np
import itertools
import plotly as py
import plotly.graph_objects as go
from plotly.subplots import make_subplots

def flatten_dict(d):
    return({k: [y for x in [v[k] for v in d] for y in x] for k in d[0]})

def reindex_voxels(dl):
    m=0
    res = []
    for i,od in enumerate(dl):
        ix = len(dl[i]['x'])
        d = od.copy()
        for n in ['i','j','k']:
            d[n] = [ m + j for j in d[n] ]
        m += ix
        res.append(d)
    return(flatten_dict(res))

# some data
x = y = np.linspace(0,1,3)
x,y = np.meshgrid(x,y)
z = 1-(x+y)/2

# custom colorscale, mixed rgb and rgba, discontinuous breaks
cs = [[0.0, 'rgb(64, 64, 64)'],
    [0.25, 'rgb(64, 64, 64)'],
    [0.25, 'rgba(255, 0, 255, 0.1)'],
    [0.5, 'rgba(255, 0, 255, 0.5)'],
    [0.5, 'rgb(255, 160, 33)'],
    [0.8, 'rgb(255, 255, 129)'],
    [1.0, 'rgb(255, 255, 225)']]

# list of shapes
vxl = \
[{'x': [-0.25, -0.25, 0.25, 0.25, -0.25, -0.25, 0.25, 0.25],
  'y': [-0.25, 0.25, 0.25, -0.25, -0.25, 0.25, 0.25, -0.25],
  'z': [0.875, 0.875, 0.875, 0.875, 1.125, 1.125, 1.125, 1.125],
  'i': [7, 0, 0, 0, 4, 4, 2, 6, 4, 0, 3, 7],
  'j': [3, 4, 1, 2, 5, 6, 5, 5, 0, 1, 2, 2],
  'k': [0, 7, 2, 3, 6, 7, 1, 2, 5, 5, 7, 6],
  'intensity': [1.0, 1.0, 1.0, 1.0, 1.0, 1.0, 1.0, 1.0]},
 {'x': [0.25, 0.25, 0.75, 0.75, 0.25, 0.25, 0.75, 0.75],
  'y': [-0.25, 0.25, 0.25, -0.25, -0.25, 0.25, 0.25, -0.25],
  'z': [0.625, 0.625, 0.625, 0.625, 0.875, 0.875, 0.875, 0.875],
  'i': [7, 0, 0, 0, 4, 4, 2, 6, 4, 0, 3, 7],
  'j': [3, 4, 1, 2, 5, 6, 5, 5, 0, 1, 2, 2],
  'k': [0, 7, 2, 3, 6, 7, 1, 2, 5, 5, 7, 6],
  'intensity': [0.75, 0.75, 0.75, 0.75, 0.75, 0.75, 0.75, 0.75]},
 {'x': [0.75, 0.75, 1.25, 1.25, 0.75, 0.75, 1.25, 1.25],
  'y': [-0.25, 0.25, 0.25, -0.25, -0.25, 0.25, 0.25, -0.25],
  'z': [0.375, 0.375, 0.375, 0.375, 0.625, 0.625, 0.625, 0.625],
  'i': [7, 0, 0, 0, 4, 4, 2, 6, 4, 0, 3, 7],
  'j': [3, 4, 1, 2, 5, 6, 5, 5, 0, 1, 2, 2],
  'k': [0, 7, 2, 3, 6, 7, 1, 2, 5, 5, 7, 6],
  'intensity': [0.5, 0.5, 0.5, 0.5, 0.5, 0.5, 0.5, 0.5]},
 {'x': [-0.25, -0.25, 0.25, 0.25, -0.25, -0.25, 0.25, 0.25],
  'y': [0.25, 0.75, 0.75, 0.25, 0.25, 0.75, 0.75, 0.25],
  'z': [0.625, 0.625, 0.625, 0.625, 0.875, 0.875, 0.875, 0.875],
  'i': [7, 0, 0, 0, 4, 4, 2, 6, 4, 0, 3, 7],
  'j': [3, 4, 1, 2, 5, 6, 5, 5, 0, 1, 2, 2],
  'k': [0, 7, 2, 3, 6, 7, 1, 2, 5, 5, 7, 6],
  'intensity': [0.75, 0.75, 0.75, 0.75, 0.75, 0.75, 0.75, 0.75]},
 {'x': [0.25, 0.25, 0.75, 0.75, 0.25, 0.25, 0.75, 0.75],
  'y': [0.25, 0.75, 0.75, 0.25, 0.25, 0.75, 0.75, 0.25],
  'z': [0.375, 0.375, 0.375, 0.375, 0.625, 0.625, 0.625, 0.625],
  'i': [7, 0, 0, 0, 4, 4, 2, 6, 4, 0, 3, 7],
  'j': [3, 4, 1, 2, 5, 6, 5, 5, 0, 1, 2, 2],
  'k': [0, 7, 2, 3, 6, 7, 1, 2, 5, 5, 7, 6],
  'intensity': [0.5, 0.5, 0.5, 0.5, 0.5, 0.5, 0.5, 0.5]},
 {'x': [0.75, 0.75, 1.25, 1.25, 0.75, 0.75, 1.25, 1.25],
  'y': [0.25, 0.75, 0.75, 0.25, 0.25, 0.75, 0.75, 0.25],
  'z': [0.125, 0.125, 0.125, 0.125, 0.375, 0.375, 0.375, 0.375],
  'i': [7, 0, 0, 0, 4, 4, 2, 6, 4, 0, 3, 7],
  'j': [3, 4, 1, 2, 5, 6, 5, 5, 0, 1, 2, 2],
  'k': [0, 7, 2, 3, 6, 7, 1, 2, 5, 5, 7, 6],
  'intensity': [0.25, 0.25, 0.25, 0.25, 0.25, 0.25, 0.25, 0.25]},
 {'x': [-0.25, -0.25, 0.25, 0.25, -0.25, -0.25, 0.25, 0.25],
  'y': [0.75, 1.25, 1.25, 0.75, 0.75, 1.25, 1.25, 0.75],
  'z': [0.375, 0.375, 0.375, 0.375, 0.625, 0.625, 0.625, 0.625],
  'i': [7, 0, 0, 0, 4, 4, 2, 6, 4, 0, 3, 7],
  'j': [3, 4, 1, 2, 5, 6, 5, 5, 0, 1, 2, 2],
  'k': [0, 7, 2, 3, 6, 7, 1, 2, 5, 5, 7, 6],
  'intensity': [0.5, 0.5, 0.5, 0.5, 0.5, 0.5, 0.5, 0.5]},
 {'x': [0.25, 0.25, 0.75, 0.75, 0.25, 0.25, 0.75, 0.75],
  'y': [0.75, 1.25, 1.25, 0.75, 0.75, 1.25, 1.25, 0.75],
  'z': [0.125, 0.125, 0.125, 0.125, 0.375, 0.375, 0.375, 0.375],
  'i': [7, 0, 0, 0, 4, 4, 2, 6, 4, 0, 3, 7],
  'j': [3, 4, 1, 2, 5, 6, 5, 5, 0, 1, 2, 2],
  'k': [0, 7, 2, 3, 6, 7, 1, 2, 5, 5, 7, 6],
  'intensity': [0.25, 0.25, 0.25, 0.25, 0.25, 0.25, 0.25, 0.25]},
 {'x': [0.75, 0.75, 1.25, 1.25, 0.75, 0.75, 1.25, 1.25],
  'y': [0.75, 1.25, 1.25, 0.75, 0.75, 1.25, 1.25, 0.75],
  'z': [-0.125, -0.125, -0.125, -0.125, 0.125, 0.125, 0.125, 0.125],
  'i': [7, 0, 0, 0, 4, 4, 2, 6, 4, 0, 3, 7],
  'j': [3, 4, 1, 2, 5, 6, 5, 5, 0, 1, 2, 2],
  'k': [0, 7, 2, 3, 6, 7, 1, 2, 5, 5, 7, 6],
  'intensity': [0.0, 0.0, 0.0, 0.0, 0.0, 0.0, 0.0, 0.0]}]

# shape colors
cid = ['rgb(255, 255, 220)','rgb(255, 239, 113)',
       'rgb(255, 160, 33)','rgb(255, 239, 113)',
       'rgb(255, 160, 33)','rgba(255, 0, 255, 0.2)',
       'rgb(255, 160, 33)','rgba(255, 0, 255, 0.2)',
       'rgb(64, 64, 64)']

# concatenate shapes
vxa = reindex_voxels(vxl)

# concatenate and replace 'intensity' with 'vertexcolor'
vxb = reindex_voxels([{**{i:j for i,j in v.items() if i in ['x','y','z','i','j','k']},
                       **{'vertexcolor': [k]*len(v['x'])}} for k,v in zip(cid,vxl)])

# split vertices with opacity (rgba) and without opacity (rgb) , and replace 'intensity' by 'vertexcolor'
vxc0 = reindex_voxels([{**{i:j for i,j in v.items() if i in ['x','y','z','i','j','k']},
                        **{'vertexcolor': [k]*len(v['x'])}} for k,v in zip(cid,vxl) if k.startswith('rgba(')])
vxc1 = reindex_voxels([{**{i:j for i,j in v.items() if i in ['x','y','z','i','j','k']},
                        **{'vertexcolor': [k]*len(v['x'])}} for k,v in zip(cid,vxl) if k.startswith('rgb(')])

# figures
f1 = go.Figure(data=[go.Heatmap(x=x.ravel(),y=y.ravel(),z=z.ravel(),colorscale=cs)])
f2 = go.Figure(data=[go.Mesh3d(**vxa,colorscale=cs)])
f3 = go.Figure(data=[go.Mesh3d(**vxb,colorscale=cs)])
f4 = go.Figure(data=[go.Mesh3d(**vxc0)])
f5 = go.Figure(data=[go.Mesh3d(**vxc1)])

# multiple traces; 'vertexcolor' for rgb and rgba _and_ a transparent trace with 'intensity' to add a 'colorscale'
f6 = go.Figure(data=[go.Mesh3d(**vxc0),
                     go.Mesh3d(**vxc1),
                     go.Mesh3d(**vxa,opacity=0,colorscale=cs)])

#f6.show()

# merge figures
ncol=2
nrow=3
fig = make_subplots(cols=ncol,rows=nrow,vertical_spacing=0.05,horizontal_spacing=0.02,
                    specs= ( np.array([{'type':'heatmap'},{'type':'scatter3d'}]+[{'type':'scatter3d'}]*4)
                            .reshape(nrow,ncol).tolist() ),
                    subplot_titles=['f1: <b>Heatmap</b>; correct',
                                    'f2: <b>Mesh3d</b> intensity; incorrect rgb & rgba',
                                    'f3: <b>Mesh3d</b> vertexcolor; render artifacts in rgb',
                                    'f4: <b>Mesh3d</b> vertexcolor; correct for only rgba',
                                    'f5: <b>Mesh3d</b> vertexcolor; correct for only rgb',
                                    'f6: <b>Mesh3d</b> vertexcolor; separate traces for rgb & rgba'])
fig.update_layout(height=1200,width=1000,title_text='3D representation of mixed rgb and rgba colors [plotly.py={}]'.format(py.__version__))

f7 = go.Figure(fig)
for loc,f in zip(list(itertools.product(*[range(1,nrow+1),range(1,ncol+1)])),[f1,f2,f3,f4,f5,f6]):
    if f is not None:
        for d in f['data']:
            f7.add_trace(d,row=loc[0],col=loc[1])

f7.show()
Sorry, not a very short MWE...
Contributor guide
First steps
- Read the whole issue, then the project's contributing guide.
- Comment on the issue to say you are picking it up — it saves two people doing the same work.
- Fork the repository and make your change on a branch.
- Open a pull request that references the issue number.
Research direction
No repository files or tests are named. Start by running the supplied Python reproduction and separate the Mesh3d intensity, vertexcolor, colorbar, and export-rendering reports; then determine which behavior belongs to plotly.py versus Plotly.js or Orca. Done would require a maintainer-approved scope, a focused reproduction, and corresponding regression coverage.
Written by the indexing model from the issue text.
Assessment
- Tech stack
- python
- Domain
- data-visualization
- Issue type
- Bug
- Difficulty
- 5/5
- Estimated time
- Over a week
- Activity status
- Stale
- Clarity
- Needs clarification
- Newbie friendliness
- 18/100