boxmode 'group' on 'logscale' boxgap issue
Open
Nobody has claimed this yet.
bug
P3
- Dominant language
- JavaScript
- Stars
- 18.3k
- Forks
- 2k
- Avg merge
- 2d 12h
- Merged PRs (30d)
- 28
Description
Hi, There is an issue on boxplot when log scale applied.
fig.update_layout( boxmode = 'group', xaxis = dict(type = "log") )
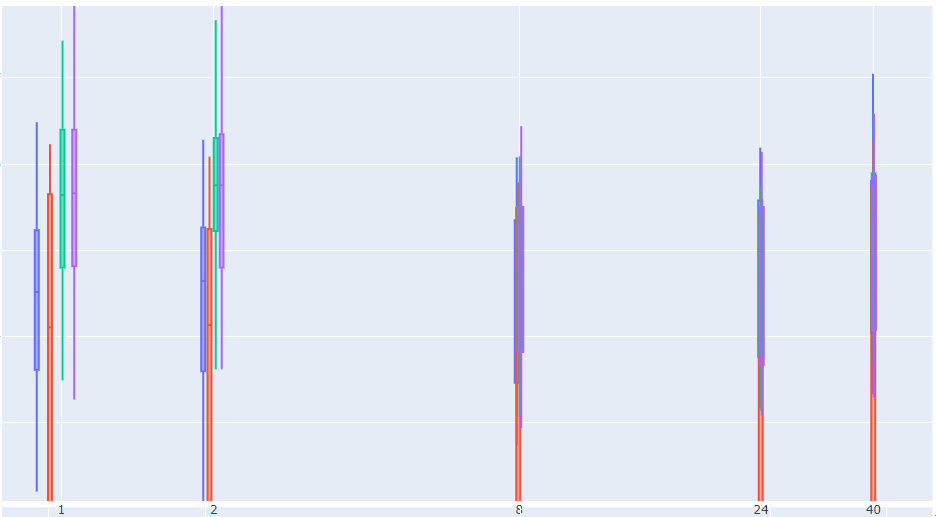
As X value increases, boxplot gap decreases more and more.
I want to same gap whatever value chagned.
This issue is exntesion of https://github.com/plotly/plotly.js/pull/4283
Contributor guide
First steps
- Read the whole issue, then the project's contributing guide.
- Comment on the issue to say you are picking it up — it saves two people doing the same work.
- Fork the repository and make your change on a branch.
- Open a pull request that references the issue number.
Research direction
Start by reproducing the reported boxplot with boxmode='group' and xaxis type='log' using the issue's snippet, then review the related plotly.js pull request #4283. Trace how grouped boxplot gaps are calculated on logarithmic axes. Done means the gap remains visually consistent as x values increase, with regression coverage for the reported case.
Written by the indexing model from the issue text.
Assessment
- Tech stack
- javascript
- Domain
- data-visualization
- Issue type
- Bug
- Difficulty
- 4/5
- Estimated time
- 3-5 days
- Activity status
- Stale
- Clarity
- Mostly clear
- Newbie friendliness
- 42/100