Time is not displayed in hover text at midnight (00:00:00)
Nobody has claimed this yet.
- Dominant language
- JavaScript
- Stars
- 18.3k
- Forks
- 2k
- Avg merge
- 2d 12h
- Merged PRs (30d)
- 28
Description
Summary:
Time is not displayed in hover text when the x-axis is of type Date and the hour, minute and second values are 00 e.g. 2017-02-04 00:00:00.10
Example:
https://codepen.io/techdude101/pen/jOLWrwW
Actual:
- The Date and y value are displayed - Feb 4, 2017, 12
- tickformat: "%H:%M:%S" - Only the y value is displayed in the hover text (screenshot below)
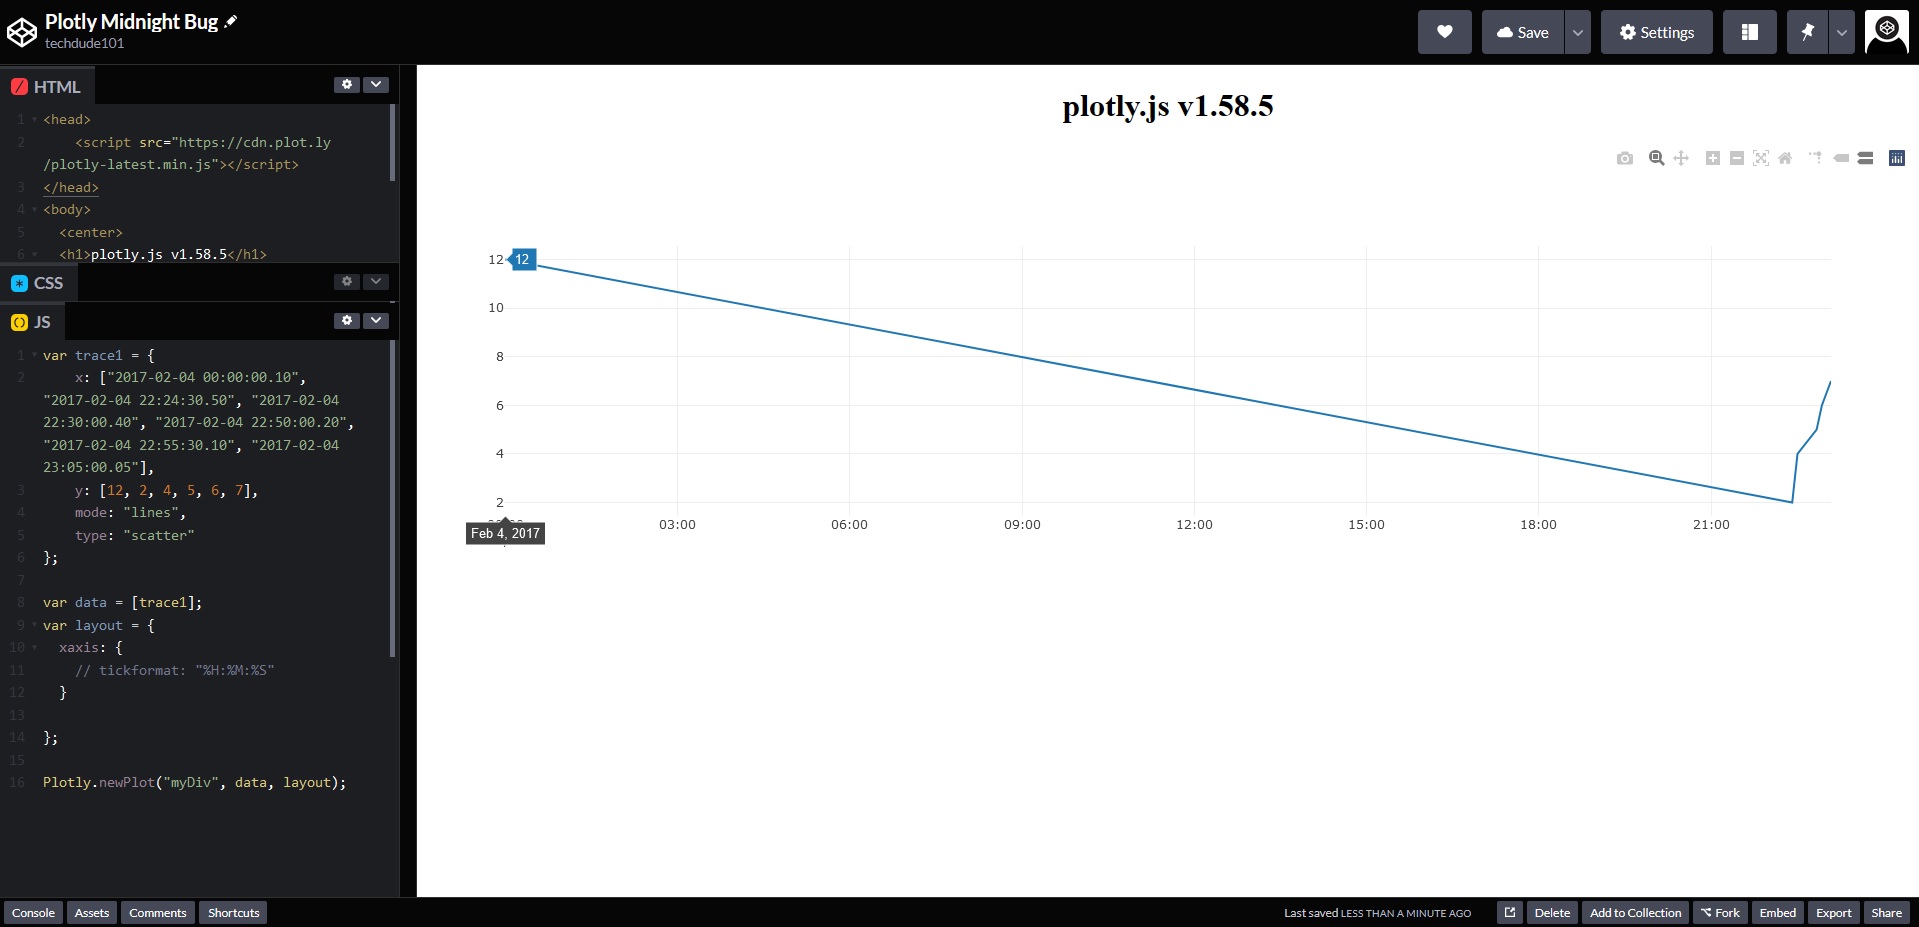
Expected:
- The Date + Time and y value are displayed - Feb 4, 2017 00:00:00, 12
- tickformat: "%H:%M:%S" - 00:00:00, 12
Test versions:
https://cdn.plot.ly/plotly-latest.min.js - plotly.js v1.58.5
https://cdn.plot.ly/plotly-2.4.2.min.js
Workaround:
Convert the Dates to strings
https://codepen.io/techdude101/pen/LYjGRzw?editors=0010
Contributor guide
First steps
- Read the whole issue, then the project's contributing guide.
- Comment on the issue to say you are picking it up — it saves two people doing the same work.
- Fork the repository and make your change on a branch.
- Open a pull request that references the issue number.
Research direction
Start by reproducing the issue with the linked CodePen examples using a Date x-axis at midnight and inspect Plotly.js's date-axis hover formatting. The fix is done when the hover text includes 00:00:00 for midnight both with the default display and with tickformat "%H:%M:%S", matching the expected examples.
Written by the indexing model from the issue text.
Assessment
- Tech stack
- d3, javascript
- Domain
- data-visualization
- Issue type
- Bug
- Difficulty
- 3/5
- Estimated time
- 1-2 days
- Activity status
- Stale
- Clarity
- Mostly clear
- Newbie friendliness
- 45/100