Range slider does not render traces defined as scattergl type
未关闭
还没有人认领这个 Issue。
bug
P3
- 主要语言
- JavaScript
- 星标
- 18.3k
- 派生
- 2k
- 平均合并
- 2 天 12 小时
- 30 天内合并 PR
- 28
描述
When using type: "scattergl" for a trace with the range slider enabled, the associated data set does not get rendered to the range slider.
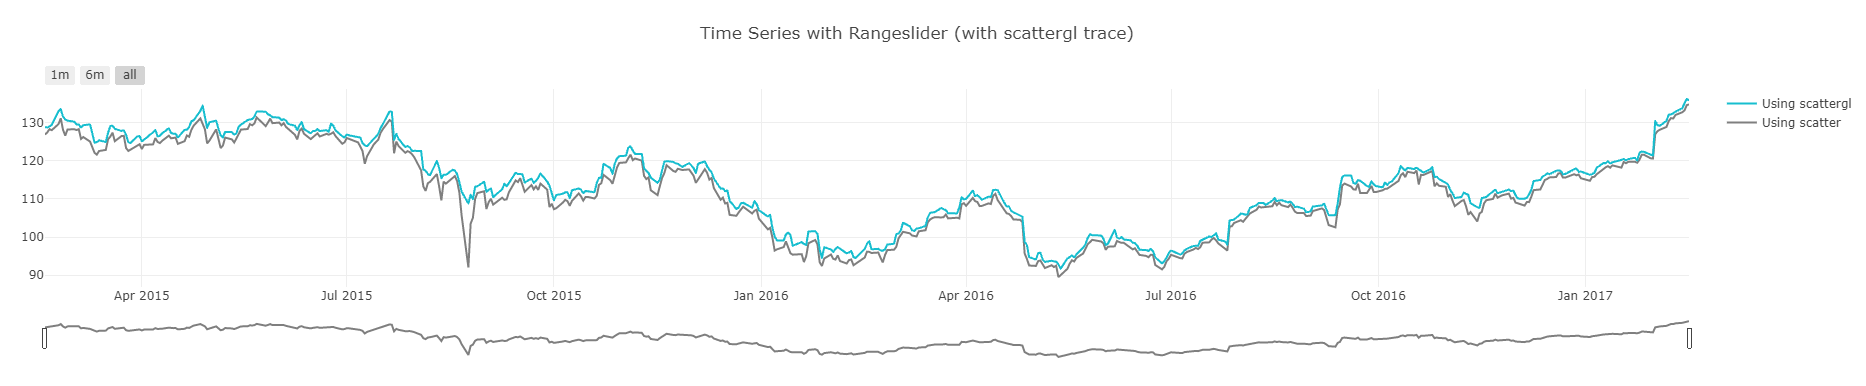
Reproduction: https://codepen.io/jrtitus/pen/poPoyjd

贡献指南
从这里开始
- 先读完整个 Issue,再读项目的贡献指南。
- 在 Issue 下留言说明你要接手 —— 这能避免两个人做同样的事。
- Fork 仓库,在一个分支上完成修改。
- 提交 Pull Request,并在描述里引用这个 Issue 编号。
调研方向
从链接的 CodePen 复现开始,将 scattergl traces 的 range-slider 行为与预期的渲染数据进行比较。跟踪 range-slider 的渲染路径和现有的 scattergl 处理;当相关的 scattergl 数据出现在已启用的 range slider 中,且不影响其他 trace 类型时,即表示完成。
由索引模型根据 Issue 内容生成。
评估
- 技术栈
- javascript
- 领域
- data-visualization
- Issue 类型
- 缺陷
- 难度
- 3/5
- 预计耗时
- 1-2 天
- 活跃度
- 停滞
- 描述清晰度
- 基本清楚
- 新手友好度
- 45/100