Plotly not showing subgroup identificator in horizontal version
還沒有人認領這個 Issue。
- 主要語言
- JavaScript
- 星號
- 18.3k
- 分支
- 2k
- 平均合併
- 2 天 12 小時
- 30 天內合併 PR
- 28
描述
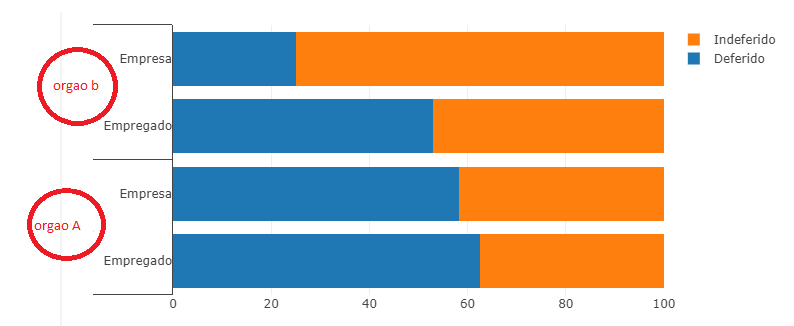
Using the horizontal version, Plotly doesn't show the subgroup identification. I thought if my code was wrong, but no, because in vertical mode, it shows perfectly. It can be fixed setting the left margin.
trace1 = go.Bar(x = [ 5, 7, 9, 2 ],
y = [["Orgao A", "Orgao A", "Orgao B", "Orgao B" ],
["Empregado", "Empresa", "Empregado", "Empresa"]],
orientation="h",
name="Deferido" )
trace2 = go.Bar(x = [ 3, 5, 8, 6 ],
y = [["Orgao A", "Orgao A", "Orgao B", "Orgao B" ],
["Empregado", "Empresa", "Empregado", "Empresa"]],
orientation="h",
name="Indeferido" )
layout = go.Layout( barmode="stack", barnorm="percent" ) #, margin=dict(l=200) #this fix the problem
fig = go.Figure( data = [ trace1, trace2 ], layout=layout )
iplot( fig )
貢獻指南
從這裡開始
- 先讀完整個 Issue,再讀專案的貢獻指南。
- 在 Issue 下留言說明你要接手 —— 這能避免兩個人做同樣的事。
- Fork 儲存庫,在一個分支上完成修改。
- 送出 Pull Request,並在描述裡引用這個 Issue 編號。
研究方向
首先執行提供的 Python 範例,並比較水平模式和垂直模式,包括左邊距 workaround。追蹤負責水平群組長條圖中子群組標籤的 plotly.js 版面配置路徑。完成的標準是:不需要手動增加左邊距即可呈現子群組識別,且該範例具有回歸涵蓋。
由索引模型根據 Issue 內容生成。
評估
- 技術堆疊
- javascript, python
- 領域
- data-visualization
- Issue 類型
- 缺陷
- 難度
- 4/5
- 預估耗時
- 3-5 天
- 活躍度
- 停滯
- 描述清晰度
- 基本清楚
- 新手友好度
- 38/100