Plotly not showing subgroup identificator in horizontal version
Nobody has claimed this yet.
- Dominant language
- JavaScript
- Stars
- 18.3k
- Forks
- 2k
- Avg merge
- 2d 12h
- Merged PRs (30d)
- 28
Description
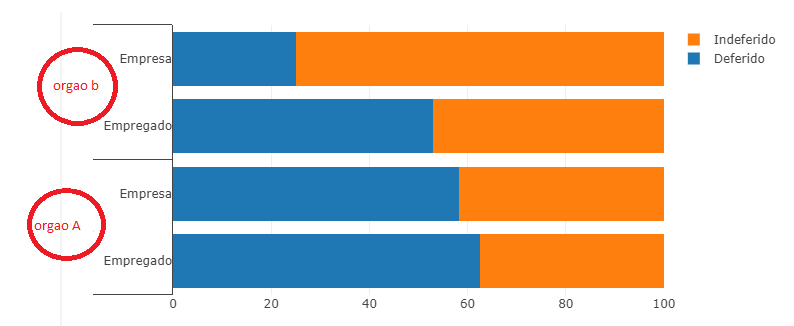
Using the horizontal version, Plotly doesn't show the subgroup identification. I thought if my code was wrong, but no, because in vertical mode, it shows perfectly. It can be fixed setting the left margin.
trace1 = go.Bar(x = [ 5, 7, 9, 2 ],
y = [["Orgao A", "Orgao A", "Orgao B", "Orgao B" ],
["Empregado", "Empresa", "Empregado", "Empresa"]],
orientation="h",
name="Deferido" )
trace2 = go.Bar(x = [ 3, 5, 8, 6 ],
y = [["Orgao A", "Orgao A", "Orgao B", "Orgao B" ],
["Empregado", "Empresa", "Empregado", "Empresa"]],
orientation="h",
name="Indeferido" )
layout = go.Layout( barmode="stack", barnorm="percent" ) #, margin=dict(l=200) #this fix the problem
fig = go.Figure( data = [ trace1, trace2 ], layout=layout )
iplot( fig )
Contributor guide
First steps
- Read the whole issue, then the project's contributing guide.
- Comment on the issue to say you are picking it up — it saves two people doing the same work.
- Fork the repository and make your change on a branch.
- Open a pull request that references the issue number.
Research direction
Start by running the provided Python example and compare horizontal and vertical modes, including the left-margin workaround. Trace the plotly.js layout path responsible for subgroup labels in horizontal grouped bars. Done means subgroup identification renders without requiring a manually increased left margin, with regression coverage for the example.
Written by the indexing model from the issue text.
Assessment
- Tech stack
- javascript, python
- Domain
- data-visualization
- Issue type
- Bug
- Difficulty
- 4/5
- Estimated time
- 3-5 days
- Activity status
- Stale
- Clarity
- Mostly clear
- Newbie friendliness
- 38/100