Better selection highlighting for splom traces
Offen
Dieses Issue hat noch niemand übernommen.
feature
P2
- Vorherrschende Sprache
- JavaScript
- Sterne
- 18.3k
- Forks
- 2k
- Ø Merge
- 2 T. 12 Std.
- Gemergte PRs (30 T.)
- 28
Beschreibung
Crossfiltering within a splom is perhaps its most powerful (and fun!) feature. We should make this better by:
- When there's a
splomtrace, makedragmode: 'select'the default, rather than'zoom', so more people are encouraged to find and use this! - Further fade the deselected points.
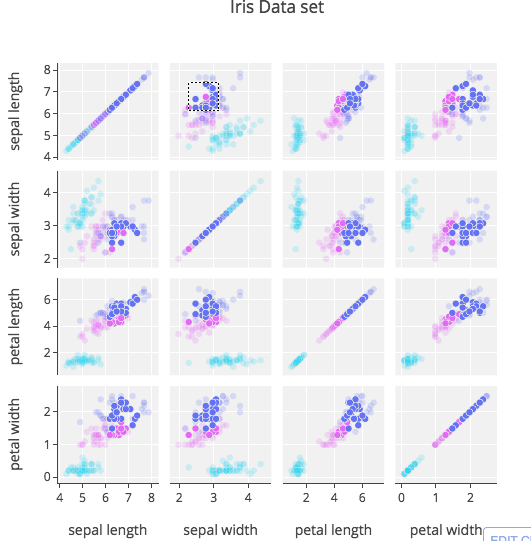
splomtraces encourage many small panes, which makes points overlap a lot, so the opacity we normally use for deselection builds up to the point you can't distinguish selected from deselected very well. We should decrease the opacity, and/or partially desaturate the colors, by default. Here's an example from https://plot.ly/python/splom/ - off-diagonal you can certainly see the selection, but it doesn't really pop out as much as it could. On diagonal, where the overlap is much greater, you can't even really see the selection:
Beitragsleitfaden
Erste Schritte
- Lies das ganze Issue und danach den Beitragsleitfaden des Projekts.
- Schreib ins Issue, dass du es übernimmst — das erspart doppelte Arbeit.
- Forke das Repository und arbeite in einem Branch.
- Öffne einen Pull Request, der die Issue-Nummer nennt.
Rechercherichtung
Es werden keine Dateien, Tests oder Einstiegspunkte genannt. Finde die Behandlung von splom-Traces und prüfe anschließend, wie die Standardwerte für dragmode und die Darstellung abgewählter Punkte ausgewählt werden; vergleiche das bestehende Auswahlverhalten, bevor du beide Standardwerte änderst. Erledigt ist die Aufgabe, wenn splom im select mode startet und ausgewählte Punkte in dichten Ansichten weiterhin klar unterscheidbar sind.
Vom Indexierungsmodell aus dem Issue-Text verfasst.
Bewertung
- Tech-Stack
- javascript
- Bereich
- data-visualization
- Issue-Typ
- Feature
- Schwierigkeit
- 4/5
- Geschätzter Aufwand
- 3-5 Tage
- Aktivitätsstatus
- Veraltet
- Klarheit
- Größtenteils klar
- Anfängerfreundlichkeit
- 35/100