Support for geom_star
未关闭
还没有人认领这个 Issue。
- 主要语言
- R
- 星标
- 2.7k
- 派生
- 641
- PR 合并指标
- 30 天内没有已合并 PR
描述
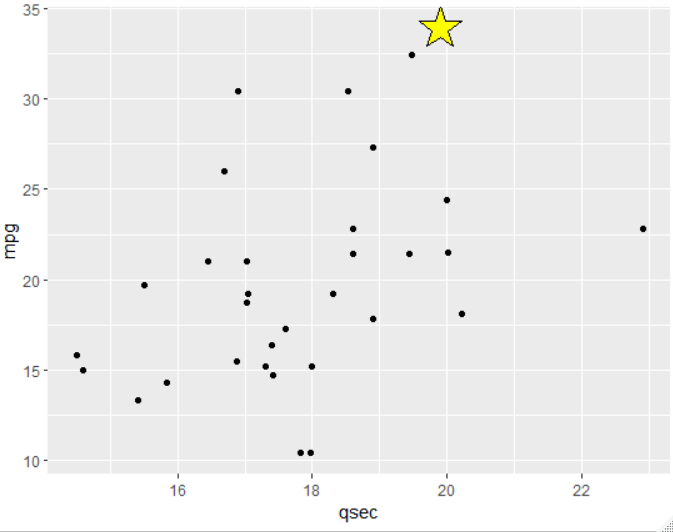
The {ggstar} package provides useful additional shapes in ggplots with the geom_star function. If support for this could be added within ggplotly, that would be very useful.
Minimal reprex:
mtcars %>%
  ggplot(aes(x=qsec, y=mpg)) +
  geom_point() +
  geom_star(data=mtcars[mtcars$mpg==max(mtcars$mpg),], #Add star at highest mpg value
            aes(x=qsec, y=mpg),
            color="black", fill="yellow", size=8, alpha=1)
贡献指南
从这里开始
- 先读完整个 Issue,再读项目的贡献指南。
- 在 Issue 下留言说明你要接手 —— 这能避免两个人做同样的事。
- Fork 仓库,在一个分支上完成修改。
- 提交 Pull Request,并在描述里引用这个 Issue 编号。
调研方向
从提供的最小 reprex 和 ggplotly 入口点开始,然后检查现有 ggplot2 几何对象的支持方式。完成标准是:ggstar 中的 geom_star 图层能够在生成的交互式图中正确渲染,包括其星形和映射的样式。
由索引模型根据 Issue 内容生成。
评估
- 技术栈
- r
- 领域
- data-visualization
- Issue 类型
- 功能
- 难度
- 4/5
- 预计耗时
- 3-5 天
- 活跃度
- 停滞
- 描述清晰度
- 基本清楚
- 新手友好度
- 35/100