highlight_key selects wrong category with boxplots and violin figures.
还没有人认领这个 Issue。
- 主要语言
- R
- 星标
- 2.7k
- 派生
- 641
- PR 合并指标
- 30 天内没有已合并 PR
描述
the problem
When a highlight_key(~group) is added to a boxplot figure or violin figure, with the highlight group equal to the categorical x-value of the boxplot/violin figure, the wrong category gets highlighted in the figure when clicking on a box or violin.
However, the correct category gets shown when I click on an outlier point.
Minimal example:
library(plotly)
data <- mtcars
data$cyl <- as.character(data$cyl) #make cyl categorical

data %>%
	highlight_key(~cyl) %>%
	plot_ly(
		x = ~cyl, y = ~mpg,
		type = "box"
		)
Screenshot example below, where I had clicked the box with category cyl=8, but cyl=4 highlighted up:
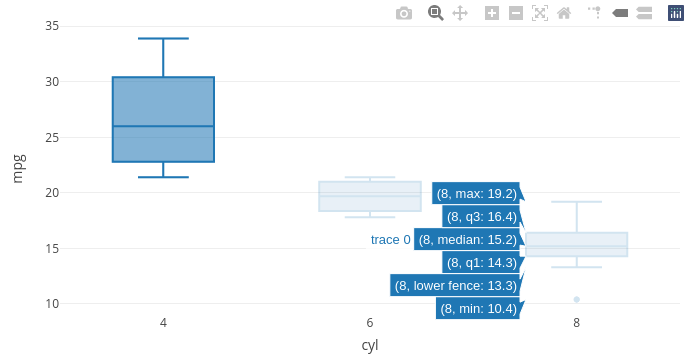
But if click on the one outlier below the box of cyl=8, the highlight is correct.
expected behaviour
When I click on the box part, the correct category gets highlighted.
System info:
> sessionInfo()
R version 3.6.3 (2020-02-29)
Platform: x86_64-pc-linux-gnu (64-bit)
Running under: Ubuntu 20.04.2 LTS

Matrix products: default
BLAS:   /usr/lib/x86_64-linux-gnu/blas/libblas.so.3.9.0
LAPACK: /usr/lib/x86_64-linux-gnu/lapack/liblapack.so.3.9.0

locale:
 [1] LC_CTYPE=en_US.UTF-8          LC_NUMERIC=C
 [3] LC_TIME=de_BE.UTF-8           LC_COLLATE=en_US.UTF-8
 [5] LC_MONETARY=de_BE.UTF-8       LC_MESSAGES=en_US.UTF-8
 [7] LC_PAPER=de_BE.UTF-8          LC_NAME=de_BE.UTF-8
 [9] LC_ADDRESS=de_BE.UTF-8        LC_TELEPHONE=de_BE.UTF-8
[11] LC_MEASUREMENT=de_BE.UTF-8    LC_IDENTIFICATION=de_BE.UTF-8

attached base packages:
[1] stats     graphics  grDevices utils     datasets  methods   base

other attached packages:
[1] plotly_4.9.4.1 ggplot2_3.3.3  rj_4.0.1-2

loaded via a namespace (and not attached):
 [1] Rcpp_1.0.6        later_1.2.0       pillar_1.6.0      compiler_3.6.3
 [5] tools_3.6.3       digest_0.6.27     rj.gd_4.0.1-0     jsonlite_1.7.2
 [9] lifecycle_1.0.0   tibble_3.1.1      gtable_0.3.0      viridisLite_0.4.0
[13] pkgconfig_2.0.3   rlang_0.4.11      shiny_1.6.0       DBI_1.1.1
[17] crosstalk_1.1.1   yaml_2.2.1        fastmap_1.1.0     withr_2.4.2
[21] dplyr_1.0.6       httr_1.4.2        generics_0.1.0    vctrs_0.3.8
[25] htmlwidgets_1.5.3 grid_3.6.3        tidyselect_1.1.1  glue_1.4.2
[29] data.table_1.14.0 R6_2.5.0          fansi_0.4.2       purrr_0.3.4
[33] tidyr_1.1.3       magrittr_2.0.1    promises_1.2.0.1  scales_1.1.1
[37] ellipsis_0.3.2    htmltools_0.5.1.1 assertthat_0.2.1  xtable_1.8-4
[41] mime_0.10         colorspace_2.0-1  httpuv_1.6.0      utf8_1.2.1
[45] lazyeval_0.2.2    munsell_0.5.0     crayon_1.4.1
The same behaviour was also reproduced on a windows machine running R 4.0.3
贡献指南
从这里开始
- 先读完整个 Issue,再读项目的贡献指南。
- 在 Issue 下留言说明你要接手 —— 这能避免两个人做同样的事。
- Fork 仓库,在一个分支上完成修改。
- 提交 Pull Request,并在描述里引用这个 Issue 编号。
调研方向
从 issue 中的最小 highlight_key(~cyl) 和 plot_ly(type = "box") 示例开始,然后跟踪 boxplot 和 violin 图的 highlight_key 交互路径。当点击箱线图或小提琴图能够高亮其分类 x 值,并与现有的离群点行为一致时,即视为完成;如果找到相关的测试位置,则添加回归检查。
由索引模型根据 Issue 内容生成。
评估
- 技术栈
- r
- 领域
- data-visualization
- Issue 类型
- 缺陷
- 难度
- 4/5
- 预计耗时
- 3-5 天
- 活跃度
- 停滞
- 描述清晰度
- 基本清楚
- 新手友好度
- 42/100