`ggplotly` uses colour that doesn't match the displayed gradient when providing one single numeric value to `fill` or `colour`
未关闭
还没有人认领这个 Issue。
- 主要语言
- R
- 星标
- 2.7k
- 派生
- 641
- PR 合并指标
- 30 天内没有已合并 PR
描述
When converting from a ggplot object to a plotly interactive visualisation with ggplotly(), if there is only one numeric value for fill or colour, the wrong gradient colour is used according to the displayed legend. The legend uses a white-to-red gradient that doesn't match the blue gradient used in ggplot2.
library(ggplot2)
library(plotly)
# fill takes one numeric value
(single_value <- ggplot(mapping = aes(x = 1, y = 1, fill = 1)) +
  geom_col())

Convert to plotly:
# ggplotly(single_value)
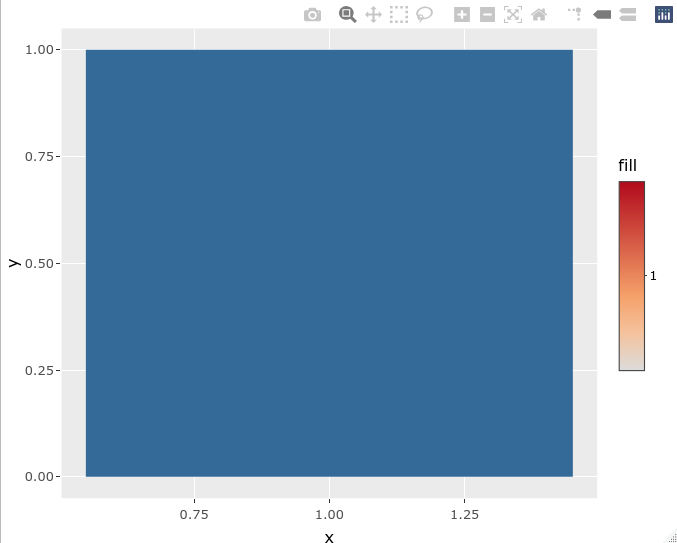
Using two numeric values works well:
# fill takes 2 numeric values
(two_values <- ggplot(mapping = aes(x = 1:2, y = 1:2, fill = 1:2)) +
    geom_col())

Convert to plotly:
# ggplotly(two_values)
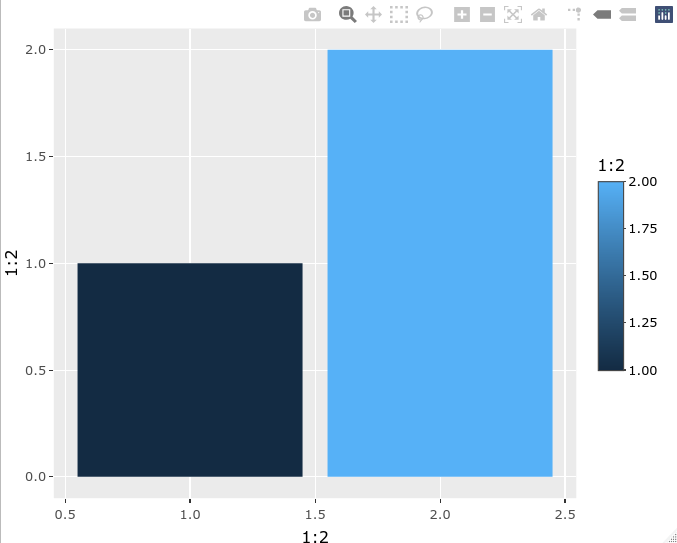
Using:
- R 4.1.0
- ggplot2 3.3.3
- plotly 4.9.3
贡献指南
从这里开始
- 先读完整个 Issue,再读项目的贡献指南。
- 在 Issue 下留言说明你要接手 —— 这能避免两个人做同样的事。
- Fork 仓库,在一个分支上完成修改。
- 提交 Pull Request,并在描述里引用这个 Issue 编号。
调研方向
首先运行 issue 中的单值和双值示例,并比较 ggplot2 与 ggplotly 的输出,重点关注 fill 或 colour 渐变以及图例。当单个数值产生的渲染渐变颜色与其显示的图例一致,并且有一个同时覆盖 fill 和 colour 的回归测试时,该 issue 即完成。
由索引模型根据 Issue 内容生成。
评估
- 技术栈
- r
- 领域
- data-visualization
- Issue 类型
- 缺陷
- 难度
- 3/5
- 预计耗时
- 1-2 天
- 活跃度
- 停滞
- 描述清晰度
- 基本清楚
- 新手友好度
- 48/100