Plotly in R. How to remove annotation based on the legend. The data points are still there when the legend is hidden.
Nobody has claimed this yet.
- Dominant language
- R
- Stars
- 2.7k
- Forks
- 641
- PR merge metrics
- No merged PRs in 30d
Description
Is there a way to remove the numbers when removing the line graph. It should display the correct data annotation when the particular legend is selected
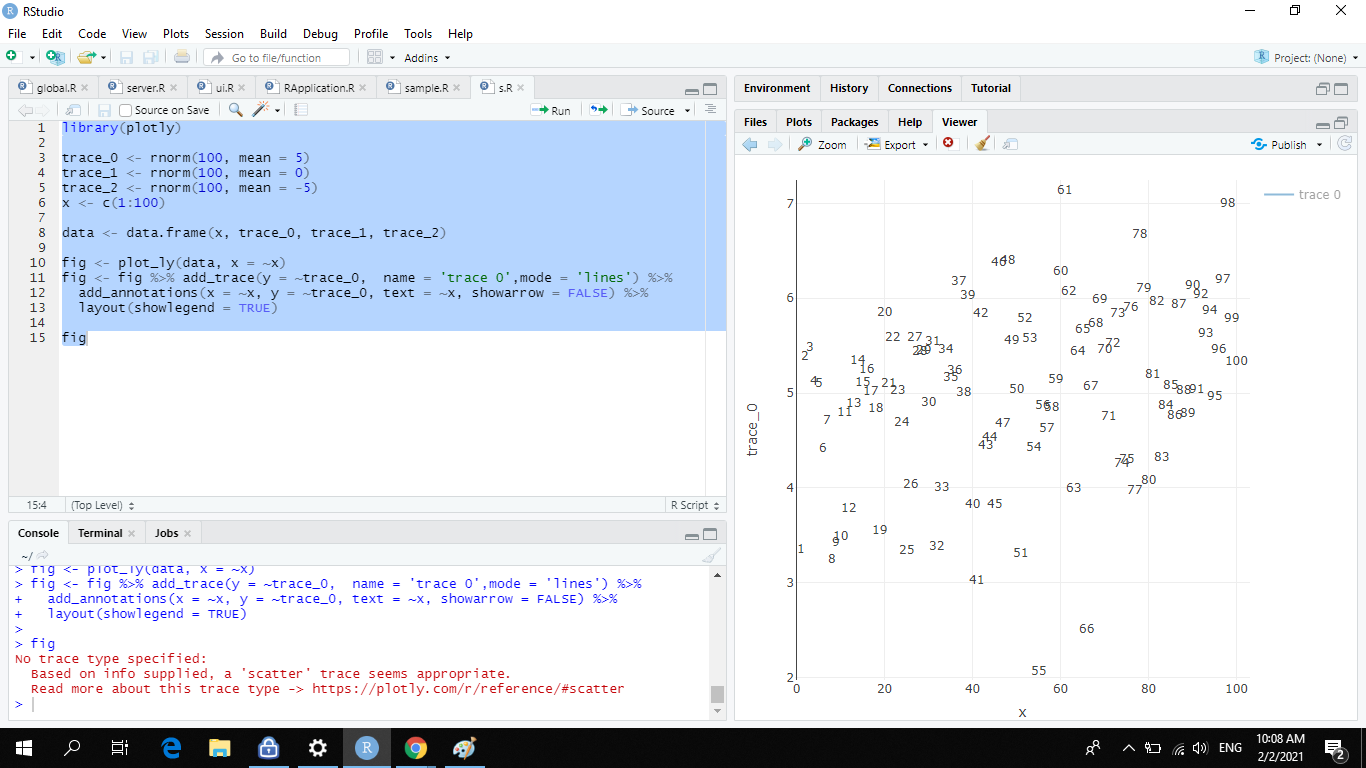
library(plotly)
trace_0 <- rnorm(100, mean = 5)
trace_1 <- rnorm(100, mean = 0)
trace_2 <- rnorm(100, mean = -5)
x <- c(1:100)
data <- data.frame(x, trace_0, trace_1, trace_2)
fig <- plot_ly(data, x = ~x)
fig <- fig %>% add_trace(y = ~trace_0, name = 'trace 0',mode = 'lines') %>%
add_annotations(x = ~x, y = ~trace_0, text = ~x, showarrow = FALSE) %>%
layout(showlegend = TRUE)
fig
Contributor guide
First steps
- Read the whole issue, then the project's contributing guide.
- Comment on the issue to say you are picking it up — it saves two people doing the same work.
- Fork the repository and make your change on a branch.
- Open a pull request that references the issue number.
Research direction
Reproduce the behavior with the provided R example using plotly, focusing on add_trace(), add_annotations(), and legend visibility. Determine how annotation visibility should follow the selected trace, then verify that hiding a legend entry also hides its annotations while preserving the correct annotations for visible traces.
Written by the indexing model from the issue text.
Assessment
- Tech stack
- r
- Domain
- data-visualization
- Issue type
- Bug
- Difficulty
- 4/5
- Estimated time
- 3-5 days
- Activity status
- Stale
- Clarity
- Mostly clear
- Newbie friendliness
- 25/100