Counts need to be strings for histogram to work
未关闭
还没有人认领这个 Issue。
- 主要语言
- R
- 星标
- 2.7k
- 派生
- 641
- PR 合并指标
- 30 天内没有已合并 PR
描述
A quirk I found today: count values need to be strings in order to be counted as numbers when inside a histogram.
fruits = c("Apples","Apples","Apples","Oranges", "Bananas")
counts = c(5,10,3,10,5)
Doesn't work:
plot_ly(y=counts,
        x=fruits,
        histfunc='sum',
        type = "histogram") %>%
  layout(yaxis=list(type='linear'))
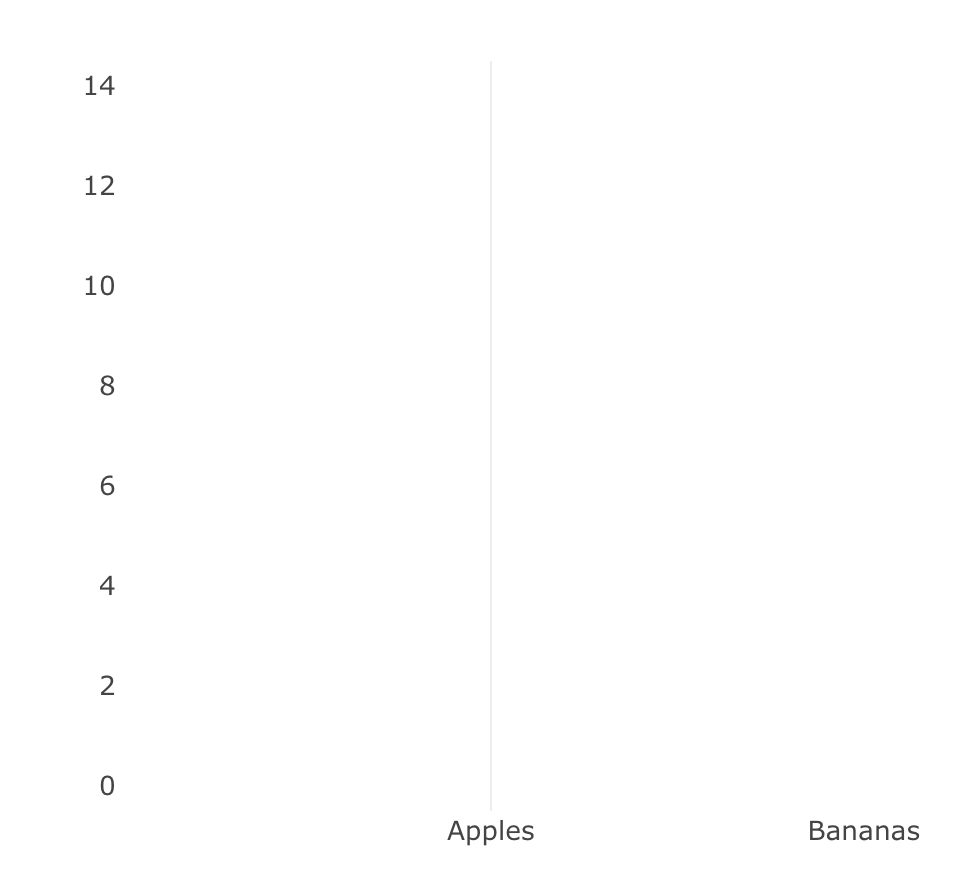
Does work:
plot_ly(y=as.character(counts),
        x=fruits,
        histfunc='sum',
        type = "histogram") %>%
  layout(yaxis=list(type='linear'))
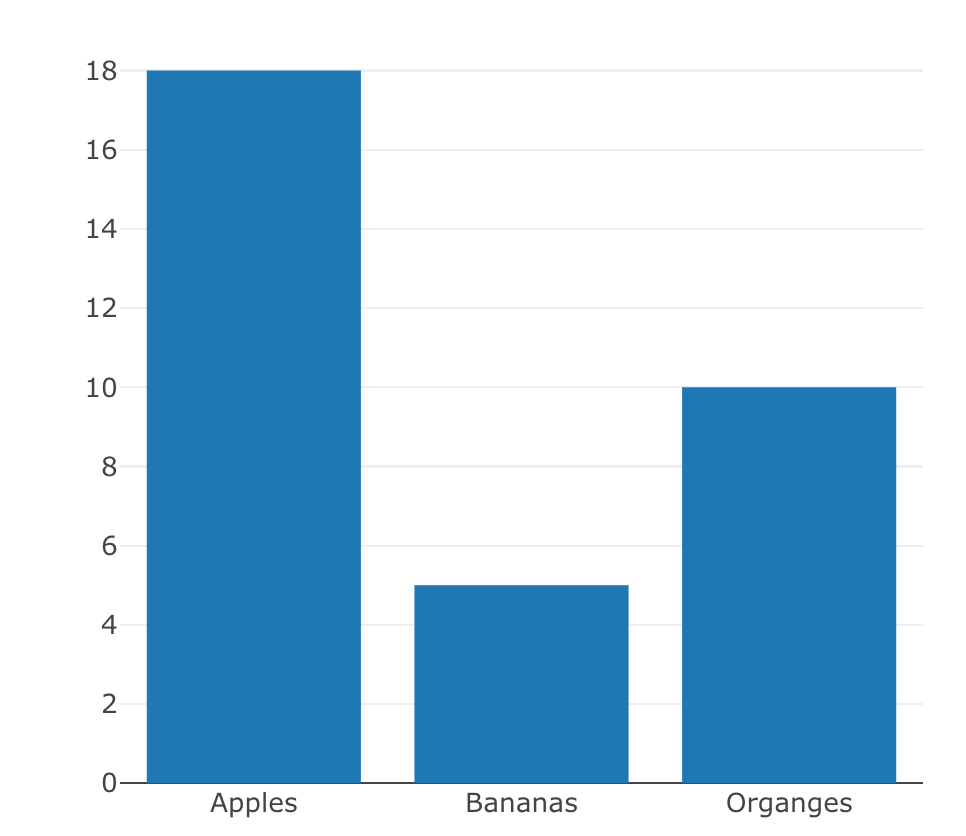
贡献指南
从这里开始
- 先读完整个 Issue,再读项目的贡献指南。
- 在 Issue 下留言说明你要接手 —— 这能避免两个人做同样的事。
- Fork 仓库,在一个分支上完成修改。
- 提交 Pull Request,并在描述里引用这个 Issue 编号。
调研方向
首先复现 issue 中的两个 plot_ly 直方图示例,并将数值 counts 与 as.character(counts) 进行比较。跟踪 histfunc='sum' 的直方图处理流程,确定数值 counts 在何处受到不同处理。完成的标准是:数值 counts 无需转换为字符值即可生成相同的预期直方图。
由索引模型根据 Issue 内容生成。
评估
- 技术栈
- r
- 领域
- data-visualization
- Issue 类型
- 缺陷
- 难度
- 3/5
- 预计耗时
- 1-2 天
- 活跃度
- 停滞
- 描述清晰度
- 基本清楚
- 新手友好度
- 45/100