Strange results with GeoJSON
Open
Nobody has claimed this yet.
- Dominant language
- R
- Stars
- 2.7k
- Forks
- 641
- PR merge metrics
- No merged PRs in 30d
Description
I tried plot choropleth with Highcharts GeoJSON.
Code to reproduce:
# packages ----------------------------------------------------------------
library(jsonlite)
library(plotly)

# prepare data ------------------------------------------------------------
# read geo data
map_data <- read_json(path = "https://raw.githubusercontent.com/highcharts/map-collection-dist/master/countries/es/es-all.geo.json")
# fill values to draw
df <- data.frame(
  id = unlist(lapply(map_data$features, "[[", "id")),
  name = unlist(lapply(map_data$features, "[[", c("properties", "name")))
)
df$value <- as.integer(runif(NROW(df), 0, 100))

# plotly ------------------------------------------------------------------
plotly_plt <- plot_ly() %>%
  add_trace(
    type = "choropleth",
    geojson = map_data,
    locations = df[["id"]],
    z = df[["value"]]
  ) %>%
  layout(
    geo = list(
      fitbounds = "locations"
    )
  )
plotly_plt
Screenshot of the result:
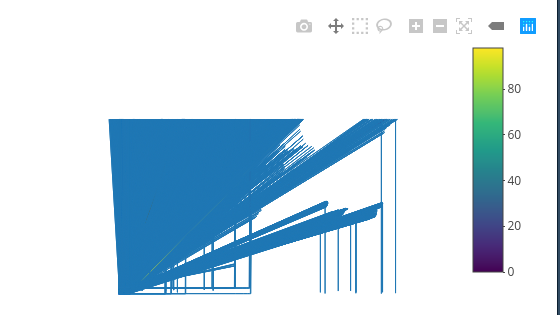
P.S.: This issue is repost SO question. Posted here because no responses on the SO.
Additional information:
─ Session info ────────────────────────────────────────────────────────────────
 setting  value
 version  R version 4.0.0 (2020-04-24)
 os       Arch Linux
 system   x86_64, linux-gnu
 ui       RStudio
 language
 collate  ru_RU.UTF-8
 ctype    ru_RU.UTF-8
 tz       Asia/Novokuznetsk
 date     2020-05-24

─ Packages ────────────────────────────────────────────────────────────────────
 package     * version date       lib source
 assertthat    0.2.1   2019-03-21 [1] CRAN (R 4.0.0)
 cli           2.0.2   2020-02-28 [1] CRAN (R 4.0.0)
 colorspace    1.4-1   2019-03-18 [1] CRAN (R 4.0.0)
 crayon        1.3.4   2017-09-16 [1] CRAN (R 4.0.0)
 crosstalk     1.1.0.1 2020-03-13 [1] CRAN (R 4.0.0)
 data.table    1.12.8  2019-12-09 [1] CRAN (R 4.0.0)
 digest        0.6.25  2020-02-23 [1] CRAN (R 4.0.0)
 dplyr         0.8.5   2020-03-07 [1] CRAN (R 4.0.0)
 ellipsis      0.3.1   2020-05-15 [1] CRAN (R 4.0.0)
 fansi         0.4.1   2020-01-08 [1] CRAN (R 4.0.0)
 farver        2.0.3   2020-01-16 [1] CRAN (R 4.0.0)
 ggplot2     * 3.3.0   2020-03-05 [1] CRAN (R 4.0.0)
 glue          1.4.1   2020-05-13 [1] CRAN (R 4.0.0)
 gtable        0.3.0   2019-03-25 [1] CRAN (R 4.0.0)
 htmltools     0.4.0   2019-10-04 [1] CRAN (R 4.0.0)
 htmlwidgets   1.5.1   2019-10-08 [1] CRAN (R 4.0.0)
 httr          1.4.1   2019-08-05 [1] CRAN (R 4.0.0)
 jsonlite    * 1.6.1   2020-02-02 [1] CRAN (R 4.0.0)
 lazyeval      0.2.2   2019-03-15 [1] CRAN (R 4.0.0)
 lifecycle     0.2.0   2020-03-06 [1] CRAN (R 4.0.0)
 magrittr      1.5     2014-11-22 [1] CRAN (R 4.0.0)
 munsell       0.5.0   2018-06-12 [1] CRAN (R 4.0.0)
 pillar        1.4.4   2020-05-05 [1] CRAN (R 4.0.0)
 pkgconfig     2.0.3   2019-09-22 [1] CRAN (R 4.0.0)
 plotly      * 4.9.2.1 2020-04-04 [1] CRAN (R 4.0.0)
 purrr         0.3.4   2020-04-17 [1] CRAN (R 4.0.0)
 R6            2.4.1   2019-11-12 [1] CRAN (R 4.0.0)
 Rcpp          1.0.4.6 2020-04-09 [1] CRAN (R 4.0.0)
 rlang         0.4.6   2020-05-02 [1] CRAN (R 4.0.0)
 rstudioapi    0.11    2020-02-07 [1] CRAN (R 4.0.0)
 scales        1.1.1   2020-05-11 [1] CRAN (R 4.0.0)
 sessioninfo   1.1.1   2018-11-05 [1] CRAN (R 4.0.0)
 tibble        3.0.1   2020-04-20 [1] CRAN (R 4.0.0)
 tidyr         1.1.0   2020-05-20 [1] CRAN (R 4.0.0)
 tidyselect    1.1.0   2020-05-11 [1] CRAN (R 4.0.0)
 vctrs         0.3.0   2020-05-11 [1] CRAN (R 4.0.0)
 viridisLite   0.3.0   2018-02-01 [1] CRAN (R 4.0.0)
 withr         2.2.0   2020-04-20 [1] CRAN (R 4.0.0)
 yaml          2.2.1   2020-02-01 [1] CRAN (R 4.0.0)
Contributor guide
First steps
- Read the whole issue, then the project's contributing guide.
- Comment on the issue to say you are picking it up — it saves two people doing the same work.
- Fork the repository and make your change on a branch.
- Open a pull request that references the issue number.
Research direction
Start by running the reproducible R example using the Highcharts Spain GeoJSON and inspect how the choropleth trace handles geojson, locations, and fitbounds. Compare the rendered map with the supplied screenshot; done means the GeoJSON regions and generated values are displayed in the expected locations without the reported strange result.
Written by the indexing model from the issue text.
Assessment
- Tech stack
- r
- Domain
- data-visualization
- Issue type
- Bug
- Difficulty
- 4/5
- Estimated time
- 3-5 days
- Activity status
- Stale
- Clarity
- Needs clarification
- Newbie friendliness
- 30/100