Subplot with faceted ggplots: misplaced facet strips with nrows>1
Dieses Issue hat noch niemand übernommen.
- Vorherrschende Sprache
- R
- Sterne
- 2.7k
- Forks
- 641
- PR-Merge-Kennzahlen
- Keine gemergten PRs in 30 T.
Beschreibung
When passing faceted ggplots to subplot(), the result is rendered properly as long as nrows=1. However, once I pass nrows=2 or greater, the facet strips become misplaced.
require(ggplot)
require(plotly)

ggiris <- qplot(Petal.Width, Sepal.Length, data = iris, color = Species)
# With nrows = 1, facets are rendered properly
subplot (ggiris , ggiris+facet_wrap(~Species))
# With nrows>1, facets are messed up
subplot (ggiris , ggiris+facet_wrap(~Species), nrows=2)

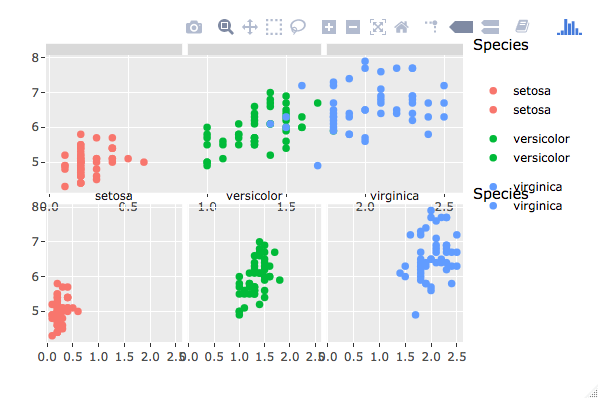
This used to work correctly on my system, using a previous version of the library - I found the error after updating plotly and a bunch of other libraries. Unfortunately, I haven't been able to restore the previous environment, so I don't know on which release it stopped working.
Beitragsleitfaden
Erste Schritte
- Lies das ganze Issue und danach den Beitragsleitfaden des Projekts.
- Schreib ins Issue, dass du es übernimmst — das erspart doppelte Arbeit.
- Forke das Repository und arbeite in einem Branch.
- Öffne einen Pull Request, der die Issue-Nummer nennt.
Rechercherichtung
Beginne damit, die Beispiele im Issue mit subplot(), facet_wrap() und nrows=2 zu reproduzieren, und verfolge dann den subplot-Einstiegspunkt sowie dessen Verarbeitung von facettierten ggplots und dem Zeilenlayout. Fertig ist die Änderung, wenn die Facet-Strips bei nrows größer als 1 korrekt positioniert bleiben und ein Regressionstest das gemeldete Beispiel abdeckt.
Vom Indexierungsmodell aus dem Issue-Text verfasst.
Bewertung
- Tech-Stack
- r
- Bereich
- data-visualization
- Issue-Typ
- Bug
- Schwierigkeit
- 4/5
- Geschätzter Aufwand
- 3-5 Tage
- Aktivitätsstatus
- Veraltet
- Klarheit
- Muss geklärt werden
- Anfängerfreundlichkeit
- 35/100