Colour legend is broken in scatterplot where only one value exists and a colorbar title is provided
未关闭
还没有人认领这个 Issue。
bug
- 主要语言
- R
- 星标
- 2.7k
- 派生
- 641
- PR 合并指标
- 30 天内没有已合并 PR
描述
Example:
library(plotly)
df <- data.frame(x = 1:5, y = 1:5, col = c(1,1,1,1,1))
plot_ly(df, x = ~x, y = ~y, color = ~col) %>%
    add_markers(marker = list(colorbar = list(title = "test")))
Result:

If any of the col values changes and it is no longer only 1's, then it works as expected. Also, if the title parameter is omitted, it also works as expected.
Here's the result when I omit the title:
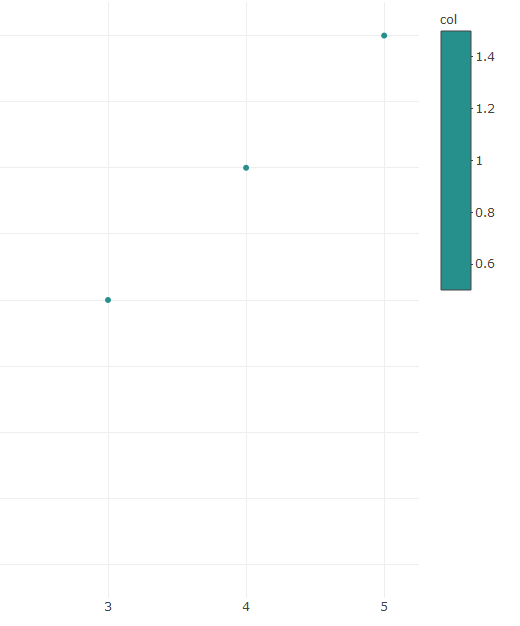
This is using plotly 4.8.0 - latest on CRAN
贡献指南
从这里开始
- 先读完整个 Issue,再读项目的贡献指南。
- 在 Issue 下留言说明你要接手 —— 这能避免两个人做同样的事。
- Fork 仓库,在一个分支上完成修改。
- 提交 Pull Request,并在描述里引用这个 Issue 编号。
调研方向
运行提供的 plotly R 示例,使用恒定的 col 值和 colorbar 标题,然后将其与省略标题或 col 变化的版本进行比较。跟踪颜色图例和 colorbar 标题的行为,并在恒定值散点图能够正确渲染标题且不破坏图例时,将该 issue 视为完成。
由索引模型根据 Issue 内容生成。
评估
- 技术栈
- r
- 领域
- data-visualization
- Issue 类型
- 缺陷
- 难度
- 3/5
- 预计耗时
- 1-2 天
- 活跃度
- 停滞
- 描述清晰度
- 基本清楚
- 新手友好度
- 35/100