Special bindings for stars data structures
未关闭
还没有人认领这个 Issue。
enhancement
- 主要语言
- R
- 星标
- 2.7k
- 派生
- 641
- PR 合并指标
- 30 天内没有已合并 PR
描述
A good start would be to replicate the plot.stars() method (from https://github.com/r-spatial/stars)
library(stars)
etm <- st_stars(system.file("tif/L7_ETMs.tif", package = "stars"))
plot(etm)
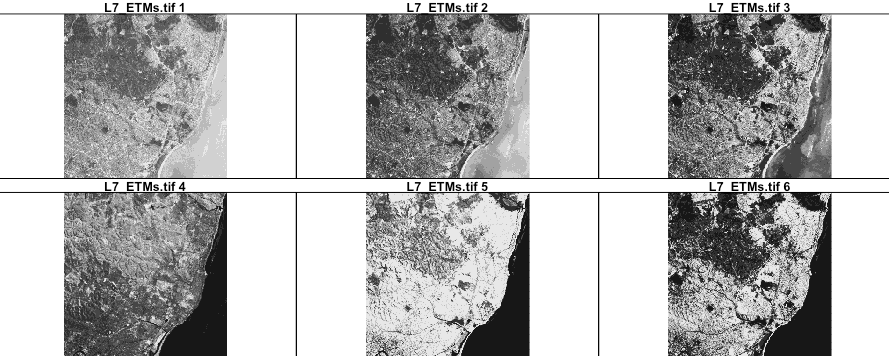
So plot_ly(etm) would do something similar to this (automatically)
library(sf)
etm <- st_transform(etm, 3857)
band <- st_dimensions(etm)[["band"]]
n <- band$to - band$from + 1
ann <- list(x = 0.5, y = 1, yanchor = "bottom", xanchor = "middle", xref = "paper", yref = "paper", showarrow = FALSE)
plots <- lapply(seq_len(n), function(i) {
  z <- t(etm[[1]][,,i])
  ann$text <- paste(names(etm), i)
  plot_ly(z = z[seq.int(nrow(z), 1), ]) %>%
    layout(annotations = ann) %>%
    colorbar(title = i)
})
subplot(plots, nrows = 2, titleX = TRUE, shareX = TRUE, shareY = TRUE)

cc @jackparmer
贡献指南
从这里开始
- 先读完整个 Issue,再读项目的贡献指南。
- 在 Issue 下留言说明你要接手 —— 这能避免两个人做同样的事。
- Fork 仓库,在一个分支上完成修改。
- 提交 Pull Request,并在描述里引用这个 Issue 编号。
调研方向
首先研究所引用的 stars::plot.stars() 行为,以及所示的 plot_ly(etm) 和 subplot() 示例。确定现有的、处理结构化数据的 plot_ly 和 subplot() 入口点,然后将完成标准定义为:自动绘制带有分带面板以及相应注释、色条和共享坐标轴的 stars 对象。
由索引模型根据 Issue 内容生成。
评估
- 技术栈
- r
- 领域
- data-visualization
- Issue 类型
- 功能
- 难度
- 5/5
- 预计耗时
- 一周以上
- 活跃度
- 停滞
- 描述清晰度
- 基本清楚
- 新手友好度
- 25/100