mne-tools / mne-tools/mne-python
Saving topomap animation doesn't include plot titles (time points)
Open
Nobody has claimed this yet.
BUG
VIZ
- Dominant language
- Python
- Stars
- 3.5k
- Forks
- 1.6k
- Avg merge
- 1d 6h
- Merged PRs (30d)
- 100
Description
MWE:
import numpy as np
from mne.datasets import sample
from mne import read_evokeds

path = sample.data_path()
fname = path + '/MEG/sample/sample_audvis-ave.fif'
condition = 'Left Auditory'
evoked = read_evokeds(fname, condition=condition, baseline=(None, 0))

times = np.linspace(start=evoked.times[0], stop=evoked.times[-1], num=25,
                    endpoint=True)

fig, anim = evoked.animate_topomap(times=times,
                                   ch_type='eeg',
                                   frame_rate=2,
                                   time_unit='s',
                                   butterfly=False,
                                   blit=False,
                                   show=False)

anim.save('/tmp/foo.gif')
Output
MovieWriter ffmpeg unavailable; using Pillow instead.
Initializing animation...
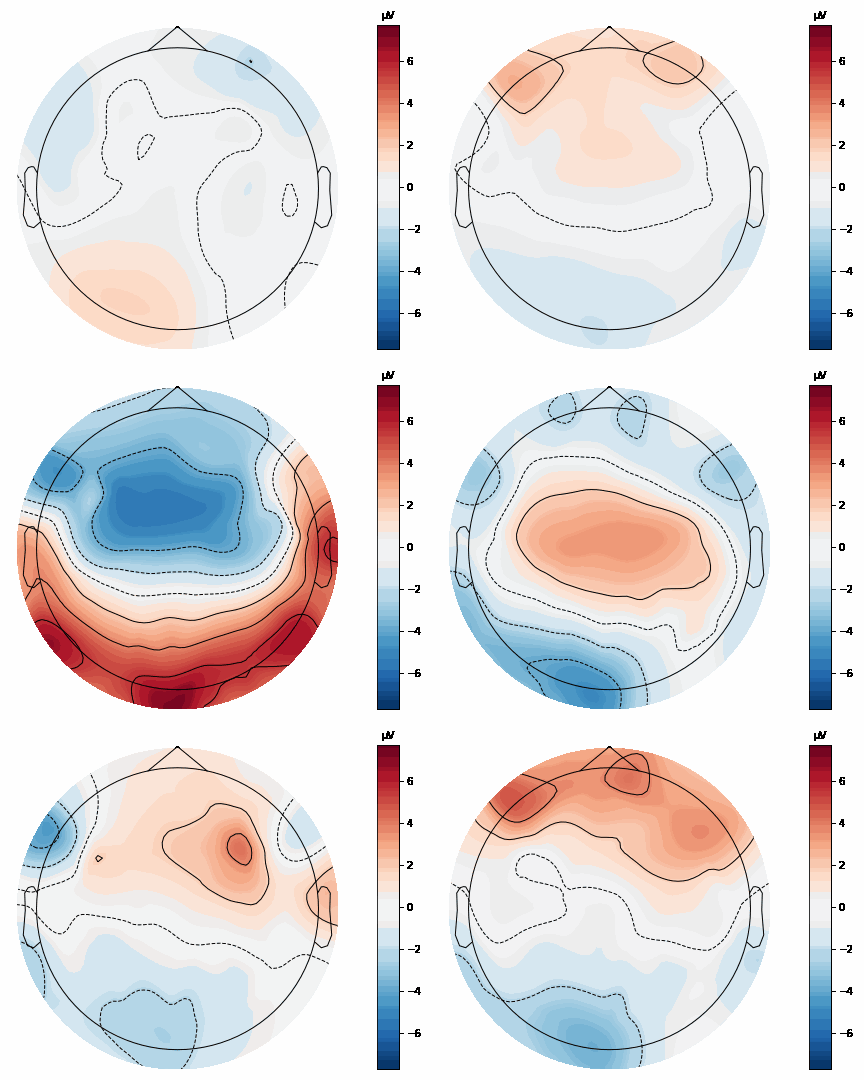
Whereas the respective Matplotlib figures contain the titles; they simply seem to get lost during saving:
https://mne.tools/dev/auto_examples/visualization/plot_evoked_topomap.html#animating-the-topomap
Contributor guide
First steps
- Read the whole issue, then the project's contributing guide.
- Comment on the issue to say you are picking it up — it saves two people doing the same work.
- Fork the repository and make your change on a branch.
- Open a pull request that references the issue number.
Research direction
Start with evoked.animate_topomap and the anim.save('/tmp/foo.gif') reproduction, then compare the saved animation with the Matplotlib figures from the plot_evoked_topomap example. Trace how titles for the time points are created and rendered during animation saving. Done means saved GIF frames retain the expected plot titles when using the provided example.
Written by the indexing model from the issue text.
Assessment
- Tech stack
- matplotlib, python
- Domain
- data-visualization
- Issue type
- Bug
- Difficulty
- 3/5
- Estimated time
- 1-2 days
- Activity status
- Stale
- Clarity
- Clearly specified
- Newbie friendliness
- 42/100