mne-tools / mne-tools/mne-python
Add option to add vertical jitter to events plot
Nobody has claimed this yet.
- Dominant language
- Python
- Stars
- 3.5k
- Forks
- 1.6k
- Avg merge
- 1d 6h
- Merged PRs (30d)
- 100
Description
Describe the problem
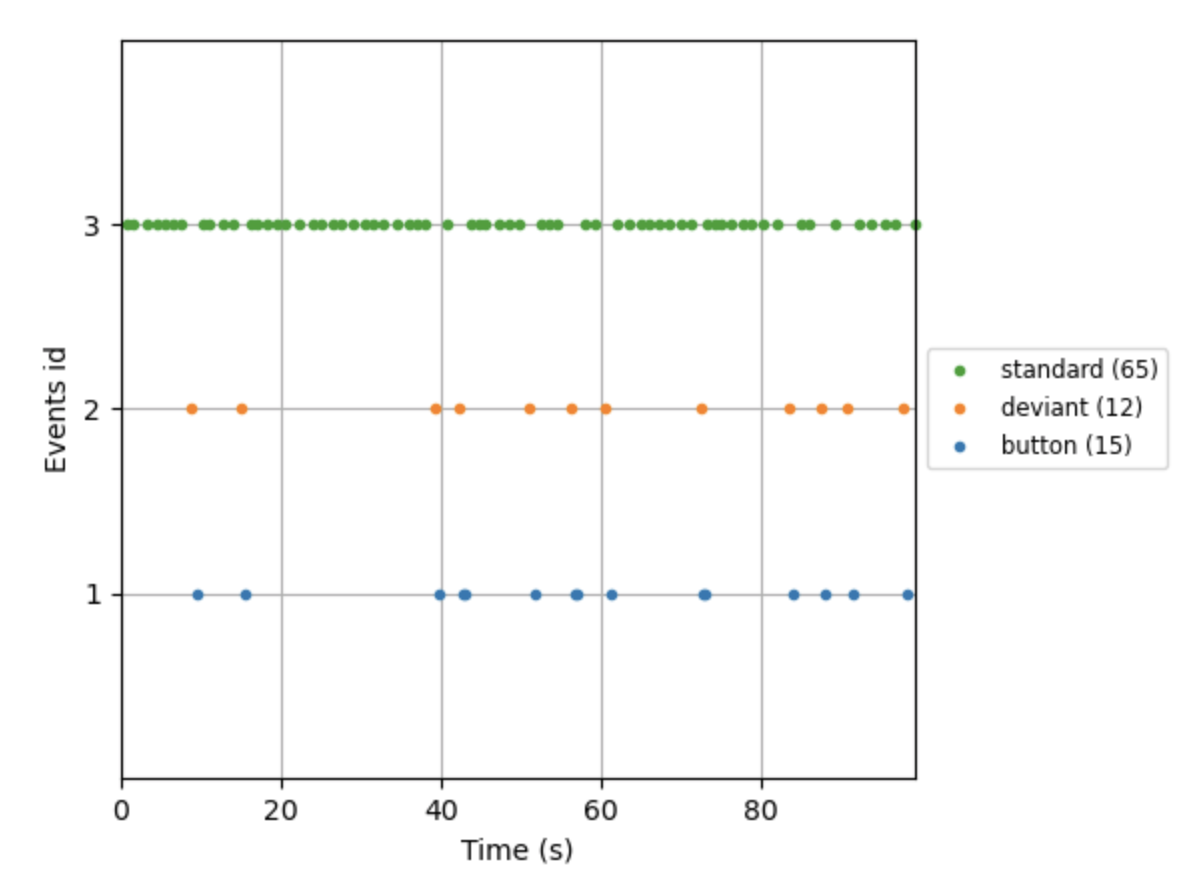
When extracting the events from the first run of the ds000246 OpenNeuro datasat and plotting them via mne.viz.plot_events(), I was convinced that the number plotted button events didn't match the number of events in the legend. Closer inspection revealed that there was simply some hard-to-spot overplotting.
Describe your solution
I therefore propose to add a jitter parameter to plot_events() which would add a vertical jitter to the event data points, reducing overplotting.
Contributor guide
First steps
- Read the whole issue, then the project's contributing guide.
- Comment on the issue to say you are picking it up — it saves two people doing the same work.
- Fork the repository and make your change on a branch.
- Open a pull request that references the issue number.
Research direction
Start at the plot_events() entry point and inspect how event data points and the legend are currently plotted. Define how an optional vertical jitter should affect the event points without changing their event identities, then add coverage for the new behavior if the existing plotting tests provide a suitable place. Done means overplotted events can be visually separated when jitter is enabled.
Written by the indexing model from the issue text.
Assessment
- Tech stack
- python
- Domain
- data-visualization
- Issue type
- Feature
- Difficulty
- 3/5
- Estimated time
- 1-2 days
- Activity status
- Stale
- Clarity
- Mostly clear
- Newbie friendliness
- 35/100