mne-tools / mne-tools/mne-python
Trouble viewing ROI-based mixed source estimates
Nobody has claimed this yet.
- Dominant language
- Python
- Stars
- 3.5k
- Forks
- 1.6k
- Avg merge
- 1d 6h
- Merged PRs (30d)
- 100
Description
Hi all,
Here is my problem: I can't project mixed source estimate data onto a PySurfer Brain object. The estimate was calculated for a source space defined on rois=['ctx_lh_G_precentral', 'ctx_lh_G_postcentral','Left-Thalamus-Proper', 'ctx_rh_G_precentral', 'ctx_rh_G_postcentral','Right-Thalamus-Proper'] using the subject's Freesurfer aparc.a2009s+aseg when setting up the source.
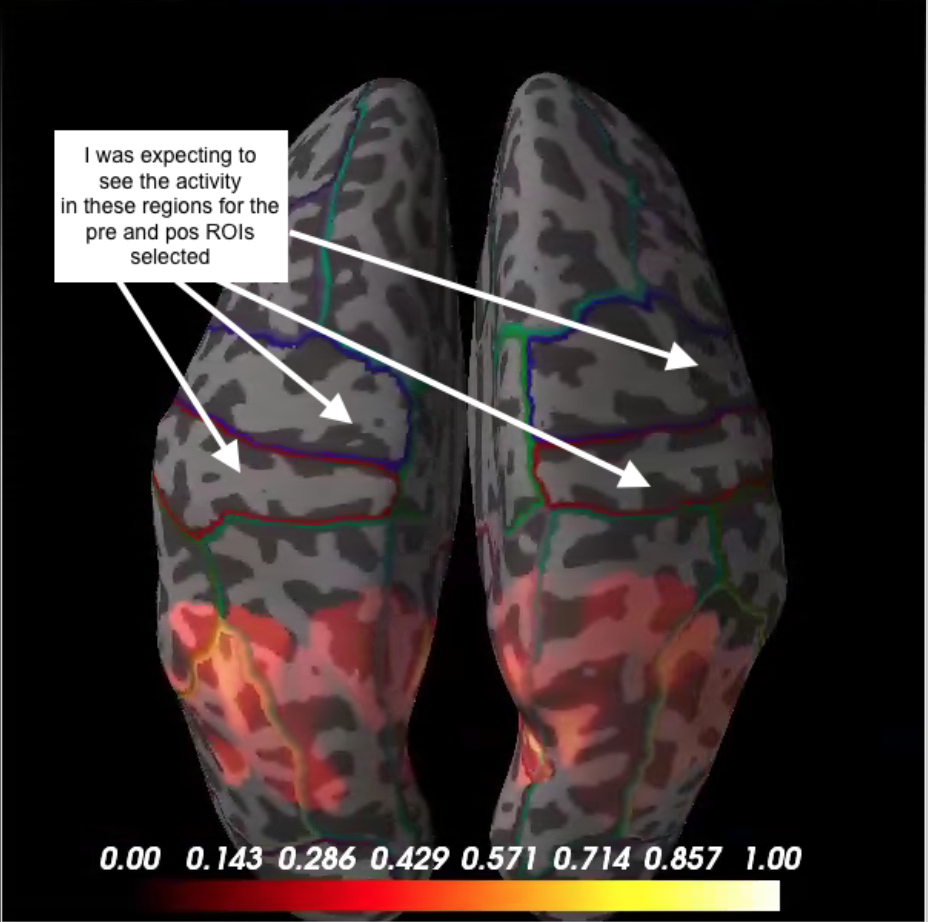
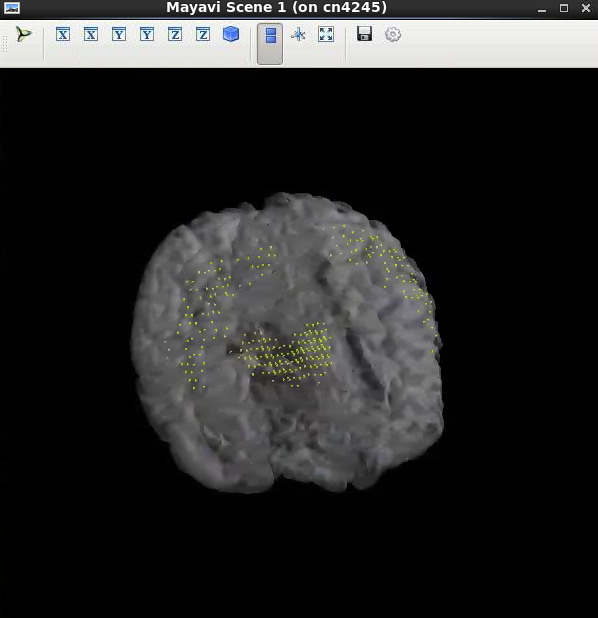
The best I could do was to use PySurfer Brain + add_data but the sources ended up at the wrong anatomical sites. However, when running plot_alignment, the sources appeared at the right locations.
Please see code and plots below. Any ideas?
Thanks!
-Leo Claudino
   # 1) This won't work because stc is a MixedSourceEstimate object
   # <mne.source_estimate.MixedSourceEstimate object at 0x2aab19789e50>
   # Note that plot_surface will call plot_source_estimates, so it won't work either
   try:
      plot_source_estimates(stc, subject=subj, hemi='both')
   except Exception, e:
      print e
      # stc has to be a surface source estimate

   # 2) Next I try using PySurfer's add_data will plot the data at the wrong location

   # Fetch coords and vertices of sources corresponding to ROIs at each hemi
   # Left hemisphere
   lh_data=[(stc.vertices[ii], fwd['src'][ii]['rr'], fwd['src'][ii]['nn'])\
   for ii in range(len(stc.vertices))\
      if find_opt(fwd['src'][ii]['seg_name'],['lh','Left'])]

   [lh_vert,lh_rr,lh_nn]=zip(*lh_data)
   lh_vert=np.concatenate(lh_vert)

   # Fetch corresponding data
   rh_mask =np.concatenate(\
   [find_opt(fwd['src'][ii]['seg_name'],['rh','Right'])*np.ones((len(stc.vertices[ii]),),dtype='int')\
   for ii in range(len(stc.vertices))])

   data_rh = np.linalg.norm(stc.data[rh_mask==1],axis=1)

   # Right hemisphere
   rh_data=[(stc.vertices[ii], fwd['src'][ii]['rr'], fwd['src'][ii]['nn'])\
   for ii in range(len(stc.vertices))\
      if find_opt(fwd['src'][ii]['seg_name'],['rh','Right'])]

   # Data
   [rh_vert,rh_rr,rh_nn]=zip(*rh_data)
   rh_vert=np.concatenate(rh_vert)

   data_lh = np.linalg.norm(stc.data[rh_mask==0],axis=1)

   # Create brain viz using PySurfer and add lh and rh data

   brain = Brain(subject_id=subj, surf='inflated',curv=True,
   subjects_dir=os.environ['SUBJECTS_DIR'], hemi='both', views=['dorsal'],size=(600, 600))

   brain.add_annotation(annot='aparc',remove_existing=False)

   brain.add_data(data_lh, vertices=lh_vert, hemi='lh',
   min=0, max=1, smoothing_steps=20, remove_existing=False, alpha=0.5,
   colormap='hot')

   brain.add_data(data_rh, vertices=rh_vert, hemi='rh',
   min=0, max=1, smoothing_steps=20, remove_existing=False, alpha=0.5,
   colormap='hot')

   # This will show the data in the wrong anatomical sites
   mlab.show()
   # 3) Next I used plot_alignment to make sure the sources were falling at the right place

   # Fetch mri_to_head transform and plot in either head or mri coordinate space
   mri_trans=fwd['mri_head_t']
   info = create_info(0, 1000., 'eeg')
   plot_alignment(info=info, surfaces='pial',src=fwd['src'],trans=mri_trans,coord_frame='mri',
   meg=False, eeg=False, dig=False, ecog=False)

   # The following shows ROIs correcly located wrt scalp
   mlab.show()
Contributor guide
First steps
- Read the whole issue, then the project's contributing guide.
- Comment on the issue to say you are picking it up — it saves two people doing the same work.
- Fork the repository and make your change on a branch.
- Open a pull request that references the issue number.
Research direction
Start by reproducing the mixed-source visualization using plot_source_estimates, PySurfer Brain.add_data, and plot_alignment with the ROI source space shown in the issue. Compare the source vertices, coordinates, and hemisphere data passed to Brain.add_data against the locations displayed by plot_alignment. Done means the mixed-source ROI data is either supported directly or displayed at the correct anatomical sites, with a regression test or documented limitation.
Written by the indexing model from the issue text.
Assessment
- Tech stack
- python
- Domain
- data-visualization
- Issue type
- Bug
- Difficulty
- 4/5
- Estimated time
- 3-5 days
- Activity status
- Stale
- Clarity
- Needs clarification
- Newbie friendliness
- 25/100