mne-tools / mne-tools/mne-python
The unit of the "Spectrum" subplot in the ICA properties figure
Nobody has claimed this yet.
- Dominant language
- Python
- Stars
- 3.5k
- Forks
- 1.6k
- Avg merge
- 1d 6h
- Merged PRs (30d)
- 100
Description
When calling ICA.plot_properties(), the ordinate of the subplot titled "Spectrum" is labeled "AU^2/Hz (dB)":
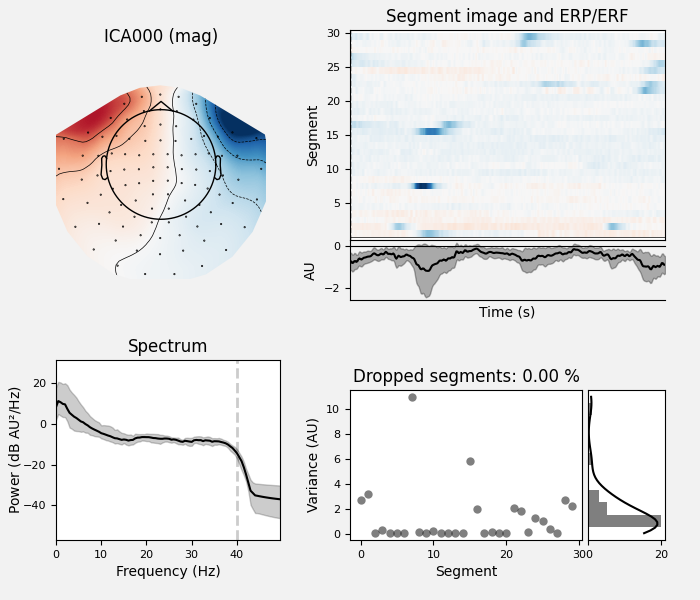
(taken from https://mne.tools/stable/auto_tutorials/preprocessing/40_artifact_correction_ica.html#looking-at-the-ica-solution)
- Why "AU" and not the unit of the sensor type (e.g., µV for EEG)?
- dB here means – what? That the plotted value is 10 log10 (AU^2/Hz)?
- Why is the subplot titled "Spectrum" and not "PSD"? Seems inconsistent with our naming elsewhere?
A comparable figure produced by EEGLAB looks like this:
(taken from https://eeglab.org/tutorials/08_Plot_data/Plotting_ICA_components.html)
Or am I reading this wrong?
I feel that the axis label there makes it much clearer to understand what's being shown.
Contributor guide
First steps
- Read the whole issue, then the project's contributing guide.
- Comment on the issue to say you are picking it up — it saves two people doing the same work.
- Fork the repository and make your change on a branch.
- Open a pull request that references the issue number.
Research direction
Start at the ICA.plot_properties() entry point and inspect how the "Spectrum" subplot and its ordinate label are produced. Compare the displayed quantity and units with the documentation example and related PSD plots; done means the title and axis label accurately describe the plotted values for the supported sensor types.
Written by the indexing model from the issue text.
Assessment
- Tech stack
- python
- Domain
- data-visualization
- Issue type
- Bug
- Difficulty
- 3/5
- Estimated time
- 1-2 days
- Activity status
- Stale
- Clarity
- Mostly clear
- Newbie friendliness
- 35/100