microsoft / microsoft/vscode-cpptools
Cannot inspect values of stl containers
Dieses Issue hat noch niemand übernommen.
- Vorherrschende Sprache
- TypeScript
- Sterne
- 6.2k
- Forks
- 1.7k
- Ø Merge
- 14 Std. 46 Min.
- Gemergte PRs (30 T.)
- 61
Beschreibung
Type: Debugger
I installed VSCode with the newest C/C++ extension, downloaded MinGW 17.1 from https://nuwen.net/mingw.html and tried to debug my CPP code, but there is either a bug, a wrong setting, or a missing feature in the debugger.
I also have MSVC but I tried to use g++ and gdb, and without installation, simply by copying them into my home directory, because in a corporate environment, one cannot use an online installer nor can install files into program files, for which one would need admin rights.
What is wrong
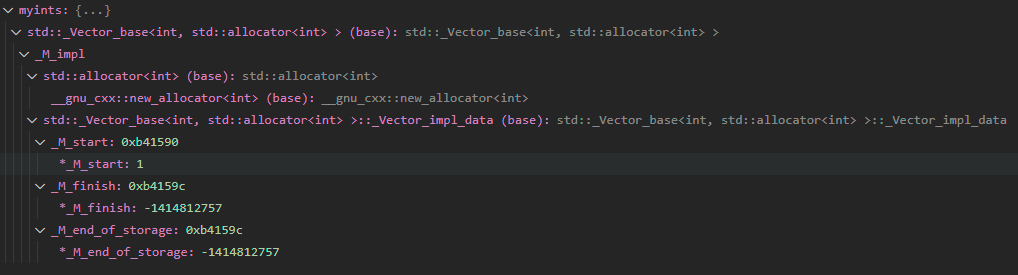
I cannot inspect the element of an stl container. In the example, I create a vector<int>, put a breakpoint into the code, and try to see its element. The debugger does not show it.
Versions
- OS and Version: Windows 10 pro x64
- VS Code Version: 1.53.0
- C/C++ Extension Version: 1.2.0
- Other extensions you installed (and if the issue persists after disabling them): g++ 9.2.0, gdb 8.3.1
Code
Use the following code and put a breakpoint within the loop:
#include <vector>
#include <iostream>

int main()
{
    std::vector<int> myints = {1, 2, 3};
    for (auto myint : myints)
        std::cout << myint; // put breakpoint here

    return 0;
}
Actual behavior
The debugger stops at the breakpoint but doesn't show the values of the vector in the VARIABLES (or Watch) tab. It only shows:
json files
lunch.json:
{
    // Use IntelliSense to learn about possible attributes.
    // Hover to view descriptions of existing attributes.
    // For more information, visit: https://go.microsoft.com/fwlink/?linkid=830387
    "version": "0.2.0",
    "configurations": [
        {
            "name": "g++.exe - Build and debug active file",
            "type": "cppdbg",
            "request": "launch",
            "program": "${fileDirname}\\${fileBasenameNoExtension}.exe",
            "args": [],
            "stopAtEntry": false,
            "cwd": "C:\\Users\\tuzes\\AppData\\Local\\MinGW\\bin",
            "environment": [],
            "console": "externalTerminal",
            "MIMode": "gdb",
            "miDebuggerPath": "C:\\Users\\tuzes\\AppData\\Local\\MinGW\\bin\\gdb.exe",
            "setupCommands": [
                {
                    "description": "Enable pretty-printing for gdb",
                    "text": "-enable-pretty-printing",
                    "ignoreFailures": true
                }
            ],
            "preLaunchTask": "C/C++: g++.exe build active file"
        }
    ]
}
tasks.json:
{
    "tasks": [
        {
            "type": "cppbuild",
            "label": "C/C++: g++.exe build active file",
            "command": "C:\\Users\\tuzes\\AppData\\Local\\MinGW\\bin\\g++.exe",
            "args": [
                "-g",
                "${file}",
                "-o",
                "${fileDirname}\\${fileBasenameNoExtension}.exe"
            ],
            "options": {
                "cwd": "C:\\Users\\tuzes\\AppData\\Local\\MinGW\\bin"
            },
            "problemMatcher": [
                "$gcc"
            ],
            "group": {
                "kind": "build",
                "isDefault": true
            },
            "detail": "Task generated by Debugger."
        }
    ],
    "version": "2.0.0"
}
c_cpp_properties.json:
{
    "configurations": [
        {
            "name": "Win32",
            "includePath": [
                "${workspaceFolder}/**"
            ],
            "defines": [
                "_DEBUG",
                "UNICODE",
                "_UNICODE"
            ],
            "windowsSdkVersion": "10.0.18362.0",
            "compilerPath": "C:/Program Files (x86)/Microsoft Visual Studio/2019/Community/VC/Tools/MSVC/14.28.29333/bin/Hostx64/x64/cl.exe",
            "cStandard": "c17",
            "cppStandard": "c++17",
            "intelliSenseMode": "windows-msvc-x64"
        },
        {
            "name": "GCC",
            "includePath": [
                "${workspaceFolder}/**"
            ],
            "defines": [
                "_DEBUG",
                "UNICODE",
                "_UNICODE"
            ],
            "windowsSdkVersion": "10.0.18362.0",
            "compilerPath": "C:/Users/tuzes/AppData/Local/MinGW/bin/g++.exe",
            "cStandard": "c17",
            "cppStandard": "c++17",
            "intelliSenseMode": "windows-gcc-x64"
        }
    ],
    "version": 4
}
Beitragsleitfaden
Erste Schritte
- Lies das ganze Issue und danach den Beitragsleitfaden des Projekts.
- Schreib ins Issue, dass du es übernimmst — das erspart doppelte Arbeit.
- Forke das Repository und arbeite in einem Branch.
- Öffne einen Pull Request, der die Issue-Nummer nennt.
Rechercherichtung
Beginne damit, das Debugger-Verhalten mit dem bereitgestellten C++-Vektorbeispiel, launch.json, tasks.json und den GDB-setupCommands nachzustellen. Untersuche die Verarbeitung des STL pretty-printing durch die Erweiterung; abgeschlossen ist die Aufgabe, wenn Vektorelemente in der VARIABLES- oder Watch-Ansicht erscheinen, wenn am Schleifen-Breakpoint angehalten wird.
Vom Indexierungsmodell aus dem Issue-Text verfasst.
Bewertung
- Tech-Stack
- cpp, vscode
- Bereich
- devtools
- Issue-Typ
- Bug
- Schwierigkeit
- 3/5
- Geschätzter Aufwand
- 1-2 Tage
- Aktivitätsstatus
- Veraltet
- Klarheit
- Muss geklärt werden
- Anfängerfreundlichkeit
- 30/100