microsoft / microsoft/vscode-cpptools
step-over show "end-steping-range" then quit when remote debug with gdb7.10 through pipetransport(ssh)
Dieses Issue hat noch niemand übernommen.
- Vorherrschende Sprache
- TypeScript
- Sterne
- 6.2k
- Forks
- 1.7k
- Ø Merge
- 14 Std. 46 Min.
- Gemergte PRs (30 T.)
- 61
Beschreibung
Type: Debugger
Can not step-over when certain printf was encountered, message from the debug console said:
*stopped,reason="end-stepping-range"
and then vscode seemed in a long waiting of this printf to return,
but the target process and gdb was still waiting on the target board.
Describe the bug
- OS and Version: Windows 10
- VS Code Version: 1.51
- C/C++ Extension Version: the newest and installed from marketplace
- Other extensions you installed (and if the issue persists after disabling them): cmake cmake-tools and recommended extensions for c/c++ developing
- gdb Version: 7.10
- A clear and concise description of what the bug is.
When step-over through c code, if it meets a certain printf expression, vscode showsconfig.c line:99*stopped,reason="end-stepping-range"and can't control the debug session anymore, no line is highlighted, no message output, only can resume or terminate this session.
Meanwhile gdb and target process was still waiting on the target board.
Those printf before this certain one were run successfully.
Manually debug on the target board using gdb works fine, even in MI mode is also right and the output seems of no problem.
The target arm board runs Linux with gdb v7.10.
vscode launch and debug the process remotely through ssh pipetransport
vscode can launch, pause, resume, restart, stop the process without problem,
and can set/unset breakpoints and break at startup as well.
To Reproduce
Please include a code sample and launch.json configuration.
Steps to reproduce the behavior:
- Launch the target process and vscode waiting on the first line
- Set breakpoint at or before the certain printf line
- Click resume/continue and vscode break at the desired line
- Click step-over until the process run to the certain printf line
- vscode lost the highlight line and seemed waiting the certain printf to return and ever waiting
Additional context
If applicable, please include logging by adding "logging": { "engineLogging": true, "trace": true, "traceResponse": true } in your launch.json
Add any other context about the problem here including log or error messages in your Debug Console or Output windows.
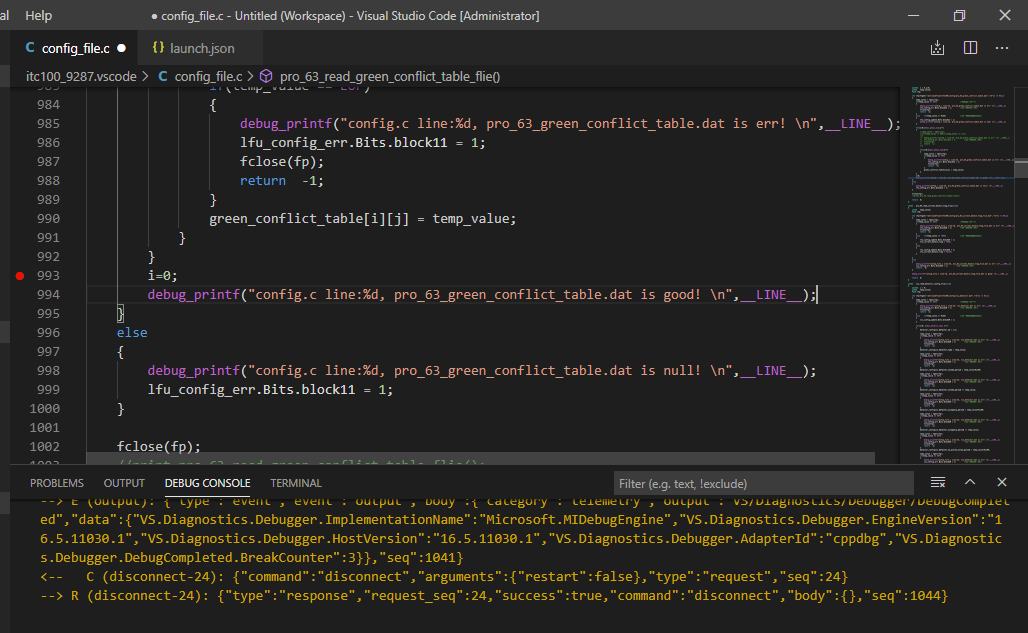
the certain printf in the source code
log of manually gdb --interpreter=mi on target board
config.c line:916, pro_1A_startup_light_status.dat is good!
=breakpoint-modified,bkpt={number="1",type="breakpoint",disp="keep",enabled="y",addr="0x0000d824",func="pro_63_read_green_conflict_table_flie",file="D:\itc100\itc100_9287.vscode/config_file.c",fullname="D:\itc100\itc100_9287.vscode/config_file.c",line="993",thread-groups=["i1"],times="1",original-location="config_file.c:993"}
~"\nBreakpoint "
~"1, pro_63_read_green_conflict_table_flie () at D:\itc100\itc100_9287.vscode/config_file.c:993\n"
&"993\tD:\itc100\itc100_9287.vscode/config_file.c: No such file or directory.\n"
*stopped,reason="breakpoint-hit",disp="keep",bkptno="1",frame={addr="0x0000d824",func="pro_63_read_green_conflict_table_flie",args=[],file="D:\itc100\itc100_9287.vscode/config_file.c",fullname="D:\itc100\itc100_9287.vscode/config_file.c",line="993"},thread-id="1",stopped-threads="all",core="0"
(gdb)
n
&"n\n"
^running
*running,thread-id="all"
(gdb)
~"994\tin D:\itc100\itc100_9287.vscode/config_file.c\n"
*stopped,reason="end-stepping-range",frame={addr="0x0000d82c",func="pro_63_read_green_conflict_table_flie",args=[],file="D:\itc100\itc100_9287.vscode/config_file.c",fullname="D:\itc100\itc100_9287.vscode/config_file.c",line="994"},thread-id="1",stopped-threads="all",core="0"
(gdb)
n
&"n\n"
^running
*running,thread-id="all"
(gdb)
config.c line:994, pro_63_green_conflict_table.dat is good!
~"1002\tin D:\itc100\itc100_9287.vscode/config_file.c\n"
*stopped,reason="end-stepping-range",frame={addr="0x0000d860",func="pro_63_read_green_conflict_table_flie",args=[],file="D:\itc100\itc100_9287.vscode/config_file.c",fullname="D:\itc100\itc100_9287.vscode/config_file.c",line="1002"},thread-id="1",stopped-threads="all",core="0"
(gdb)
n
&"n\n"
^running
*running,thread-id="all"
(gdb)
~"1005\tin D:\itc100\itc100_9287.vscode/config_file.c\n"
*stopped,reason="end-stepping-range",frame={addr="0x0000d868",func="pro_63_read_green_conflict_table_flie",args=[],file="D:\itc100\itc100_9287.vscode/config_file.c",fullname="D:\itc100\itc100_9287.vscode/config_file.c",line="1005"},thread-id="1",stopped-threads="all",core="0"
(gdb)
n
&"n\n"
^running
*running,thread-id="all"
(gdb)
~"1006\tin D:\itc100\itc100_9287.vscode/config_file.c\n"
*stopped,reason="end-stepping-range",frame={addr="0x0000d86c",func="pro_63_read_green_conflict_table_flie",args=[],file="D:\itc100\itc100_9287.vscode/config_file.c",fullname="D:\itc100\itc100_9287.vscode/config_file.c",line="1006"},thread-id="1",stopped-threads="all",core="0"
(gdb)
nquit
&"nquit\n"
&"Undefined command: "nquit". Try "help".\n"
^error,msg="Undefined command: "nquit". Try "help"."
(gdb)
quit
&"quit\n"
=thread-exited,id="1",group-id="i1"
=thread-group-exited,id="i1"
[root@EM9280 /mnt/nandflash/ITC100]#
log from vscode debug console
vsclog.txt
Beitragsleitfaden
Erste Schritte
- Lies das ganze Issue und danach den Beitragsleitfaden des Projekts.
- Schreib ins Issue, dass du es übernimmst — das erspart doppelte Arbeit.
- Forke das Repository und arbeite in einem Branch.
- Öffne einen Pull Request, der die Issue-Nummer nennt.
Rechercherichtung
Beginnen Sie mit der Überprüfung von config.c rund um den gemeldeten printf und der angehängten vsclog.txt; vergleichen Sie anschließend den VS Code MI-Austausch mit dem manuellen gdb --interpreter=mi-Protokoll. Überprüfen Sie die referenzierte launch.json-Konfiguration für remote SSH pipetransport sowie das Verhalten von gdb 7.10. Die Aufgabe ist erledigt, wenn das Überspringen über den printf hinaus fortgesetzt wird und VS Code die korrekte hervorgehobene Quellcodezeile beibehält.
Vom Indexierungsmodell aus dem Issue-Text verfasst.
Bewertung
- Tech-Stack
- c, linux
- Bereich
- devtools, operating-systems
- Issue-Typ
- Bug
- Schwierigkeit
- 4/5
- Geschätzter Aufwand
- 3-5 Tage
- Aktivitätsstatus
- Veraltet
- Klarheit
- Muss geklärt werden
- Anfängerfreundlichkeit
- 25/100