matplotlib / matplotlib/mplfinance
Feature Request: control vline width so no gaps/overlap between candles
Nadie ha tomado este issue todavía.
- Lenguaje dominante
- Python
- Estrellas
- 4.4k
- Forks
- 678
- Métricas de merge de PR
- Sin PR fusionados en 30 d
Descripción
Hello @DanielGoldfarb,
Is your feature request related to a problem? Please describe.
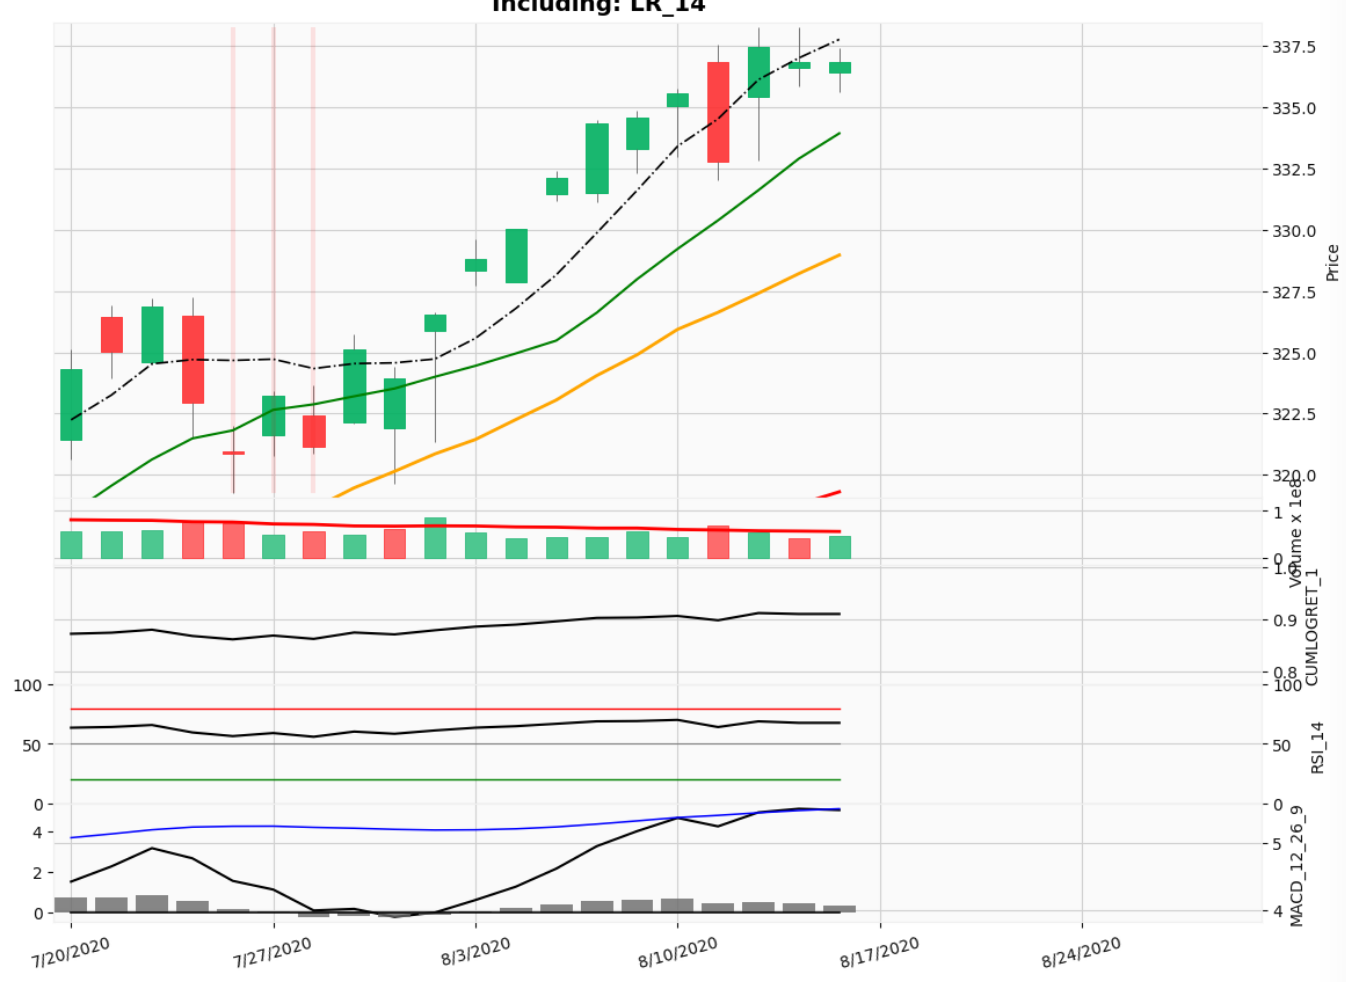
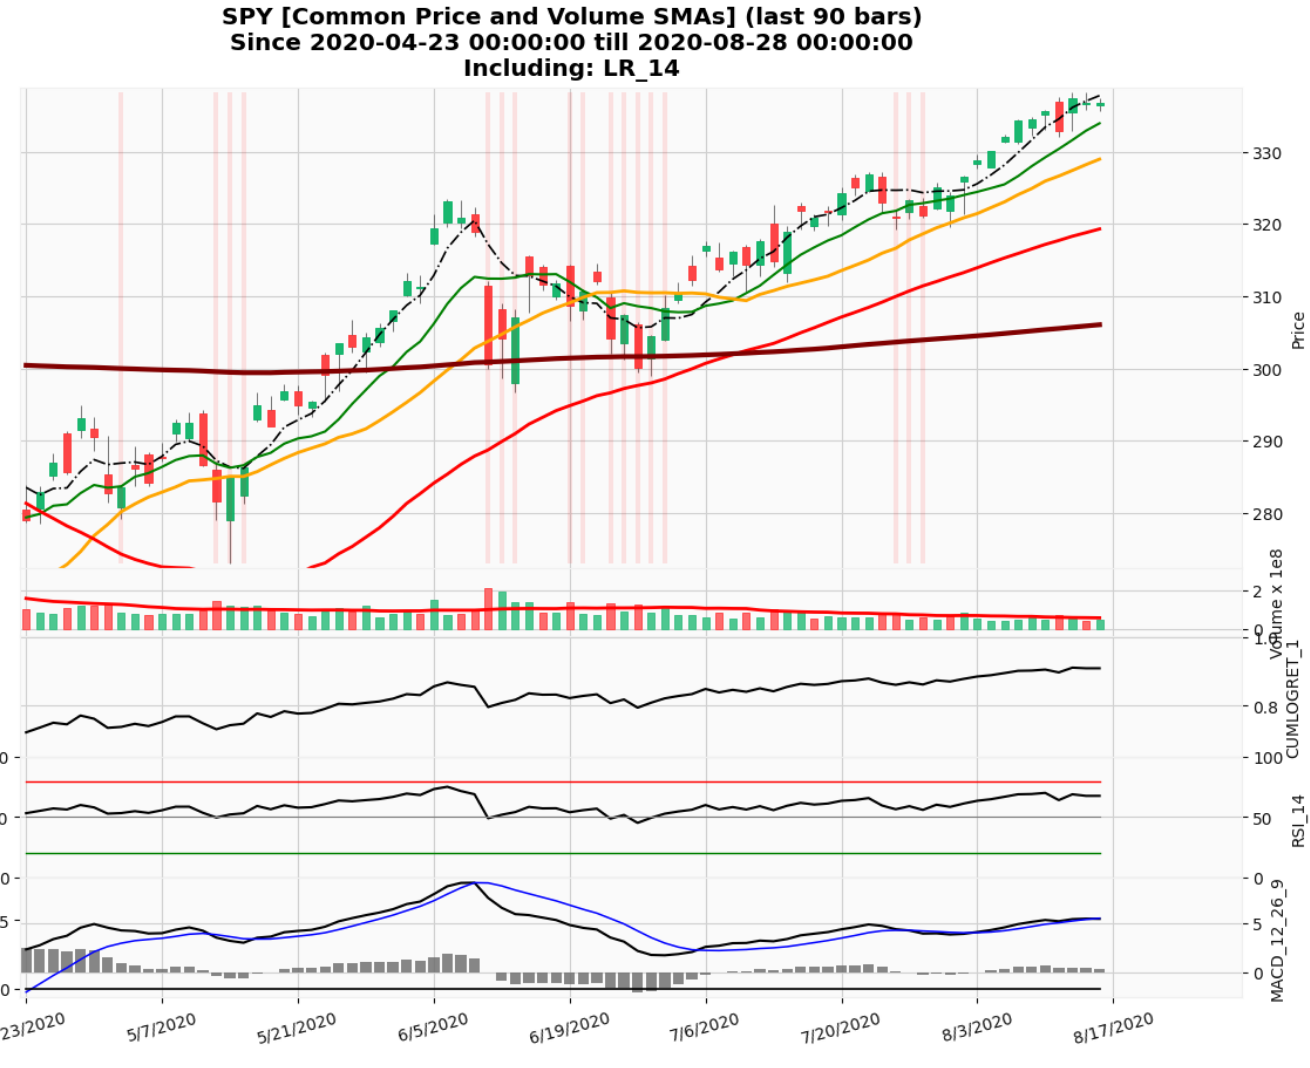
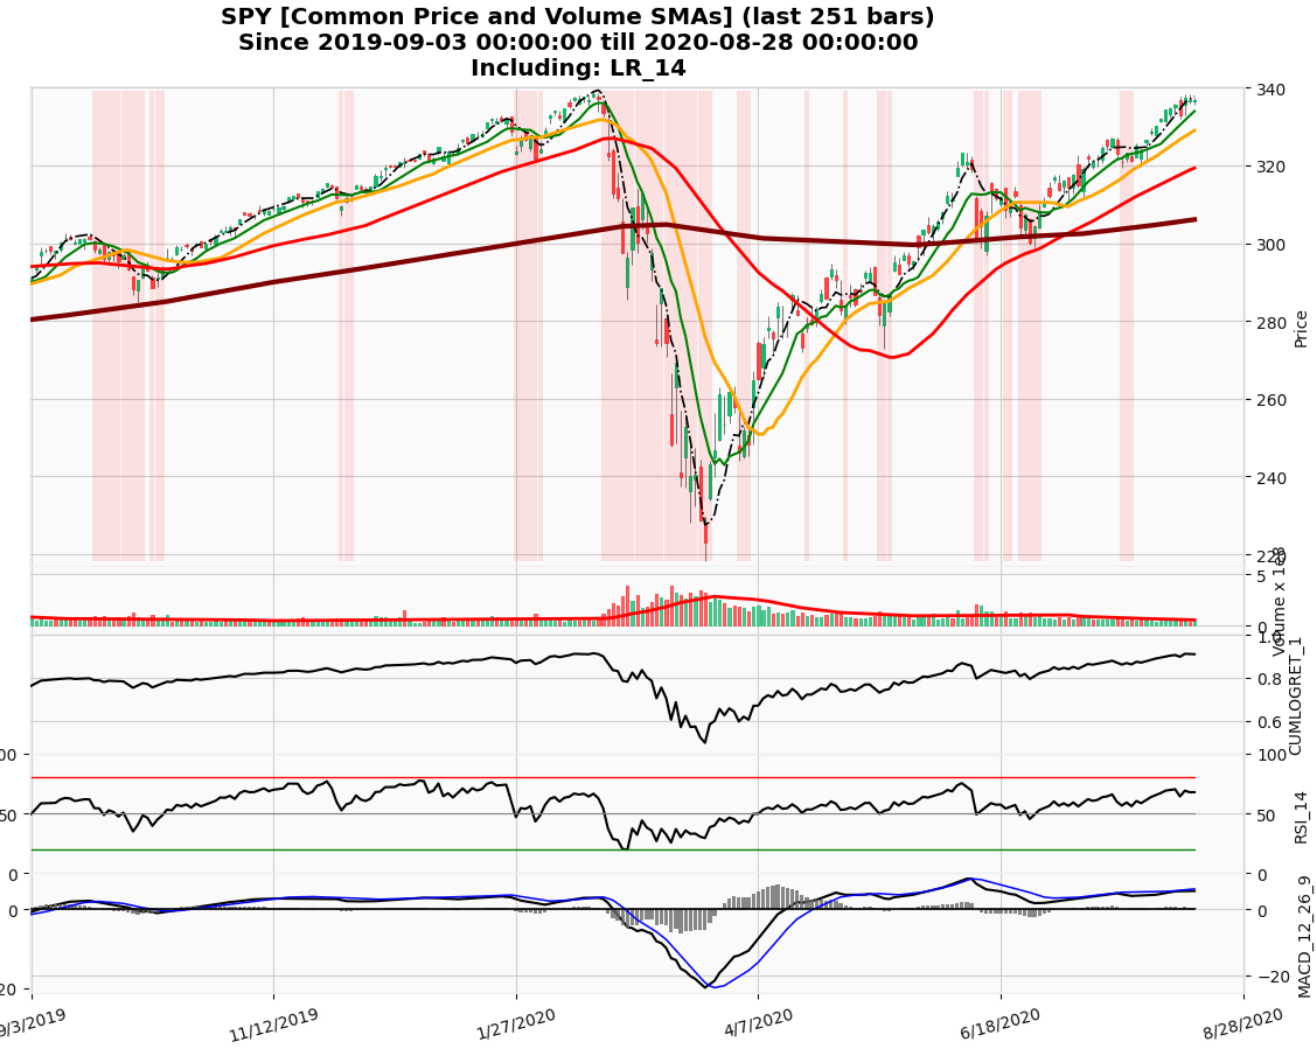
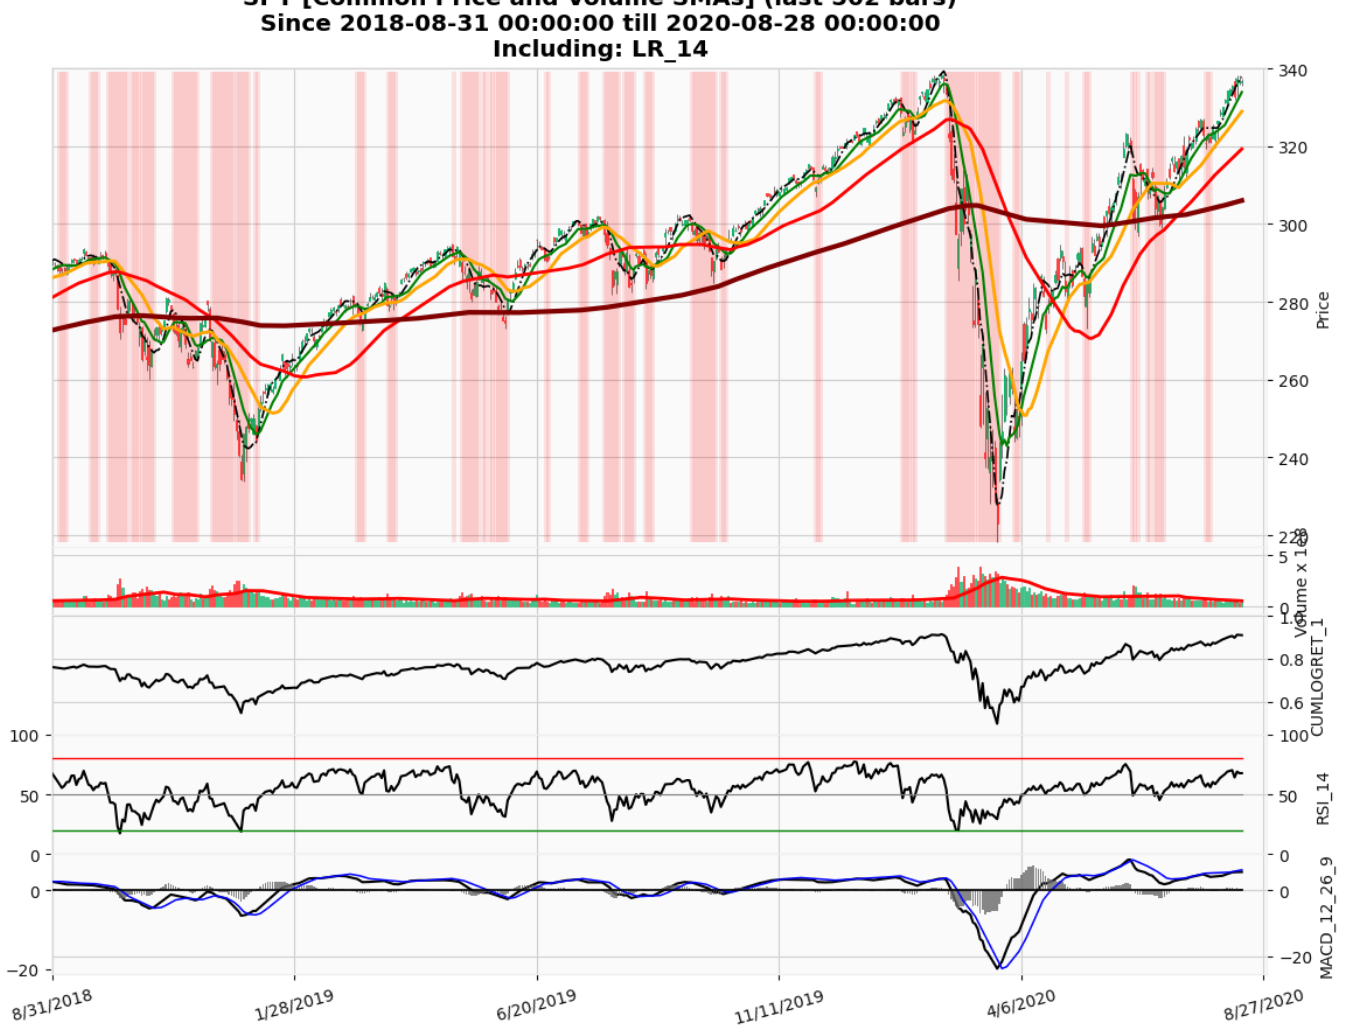
I like the vlines but they sometimes overlap when linewidths >= 8 or create gaps when linewidths < 8. It's noticeable when the number of bars are plotted.
Describe the solution you'd like
- Either another argument to passed into vlines so that there are no gaps or overlaps created.
- Or maybe something similar to vlines that is more specific for this purpose as this feature is slightly different than the original purpose of vlines.
Describe alternatives you've considered
I have not checked if it works in External Axes Mode.
Additional context
I made a semi-dynamic Panels Chart Class Example Notebook for my Pandas TA Library. The plot method is located at the bottom of Input Cell 11.
You can play around with the Chart class arguments, namely last argument, in Input Cell 12 to see what I mean.
Here are some example chart outputs:
Gaps
last = 30 and no linewidth argument used.
last = 90 and no linewidth argument used.
last = recent (recent = 251) and no linewidth argument used.
last = 2 * recent (recent = 502) and no linewidth argument used.
last = 30, linewidths=8
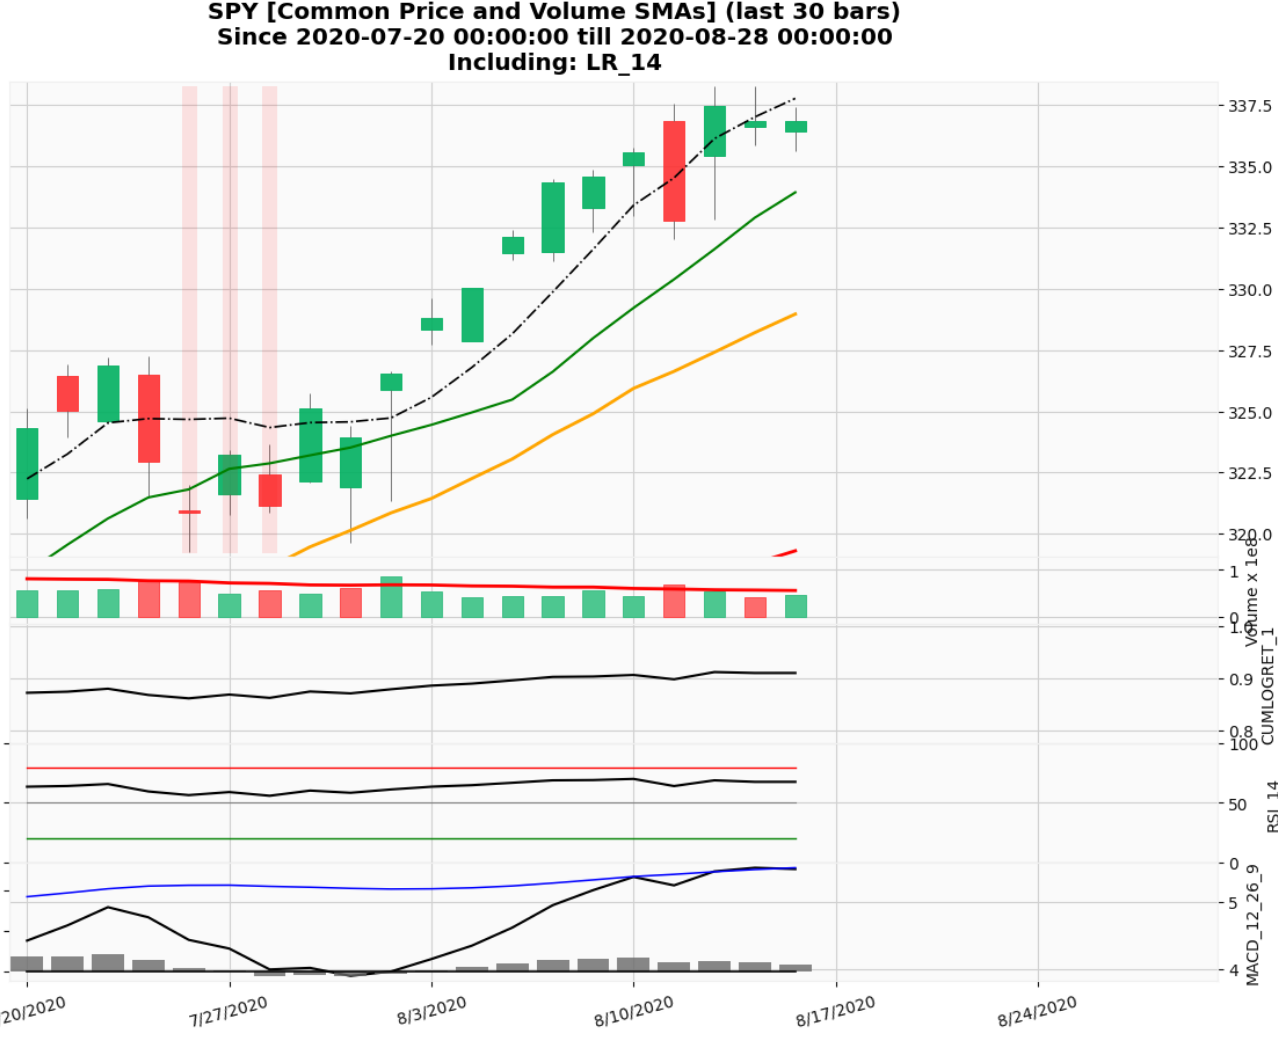
Overlap
last = 90, linewidths=8
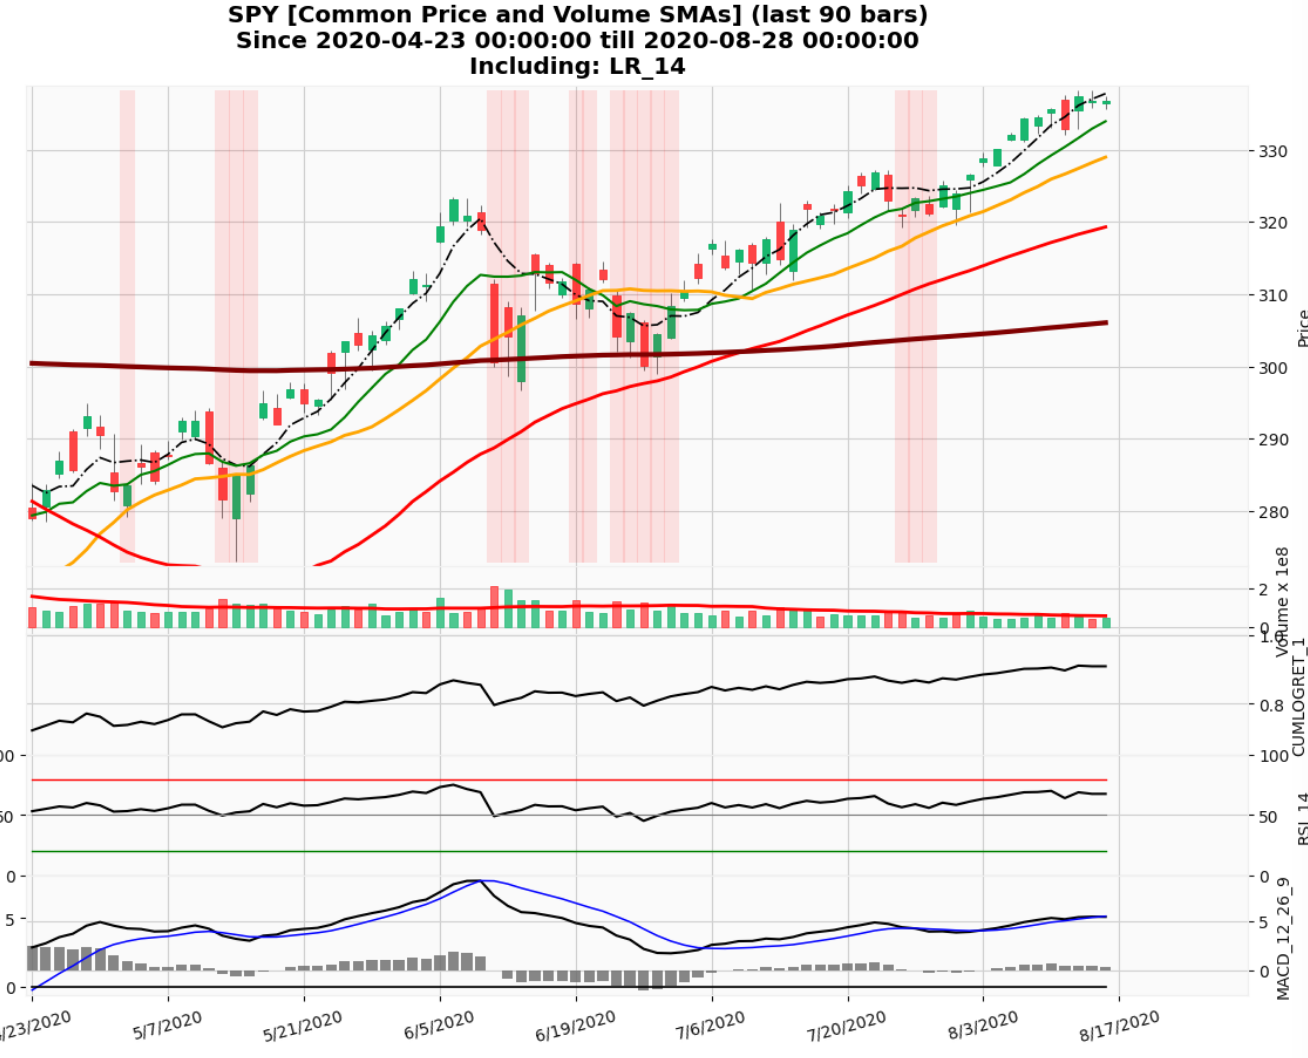
last = recent, linewidths=8
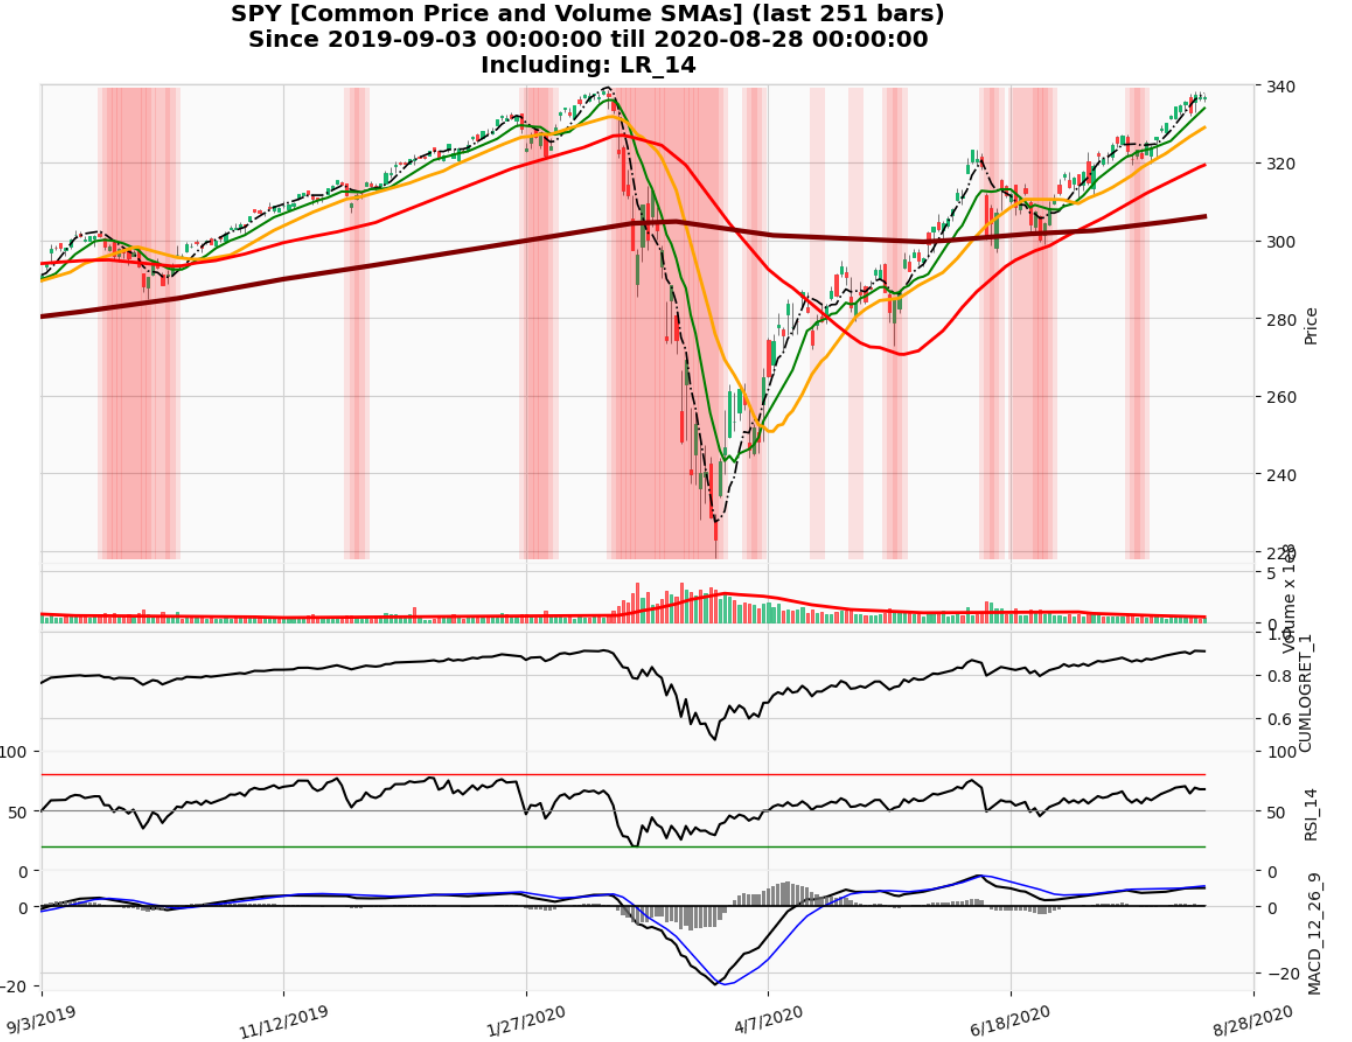
Hope this helps!
Thanks for your time,
Kevin
Guía de contribución
Primeros pasos
- Lee el issue completo y luego la guía de contribución del proyecto.
- Comenta en el issue que vas a ocuparte — evita que dos personas hagan lo mismo.
- Haz un fork del repositorio y trabaja en una rama.
- Abre un pull request que haga referencia al número del issue.
Línea de trabajo
Comienza con examples/example.ipynb, especialmente con el método plot en Input Cell 11 y los argumentos del gráfico en Input Cell 12. Reproduce las brechas y superposiciones indicadas con diferentes valores finales y linewidths, y determina después un comportamiento claro y probado para el espaciado de las velas en ambos modos de representación relevantes.
Escrito por el modelo de indexación a partir del texto del issue.
Evaluación
- Stack tecnológico
- matplotlib, python
- Área
- data-visualization
- Tipo de issue
- Nueva funcionalidad
- Dificultad
- 4/5
- Tiempo estimado
- 3-5 días
- Estado de actividad
- Estancado
- Claridad
- Necesita aclaración
- Aptitud para principiantes
- 35/100