matplotlib / matplotlib/mplfinance
Feature Request: control vline width so no gaps/overlap between candles
Nobody has claimed this yet.
- Dominant language
- Python
- Stars
- 4.4k
- Forks
- 678
- PR merge metrics
- No merged PRs in 30d
Description
Hello @DanielGoldfarb,
**Is your feature request related to a problem? Please describe.**
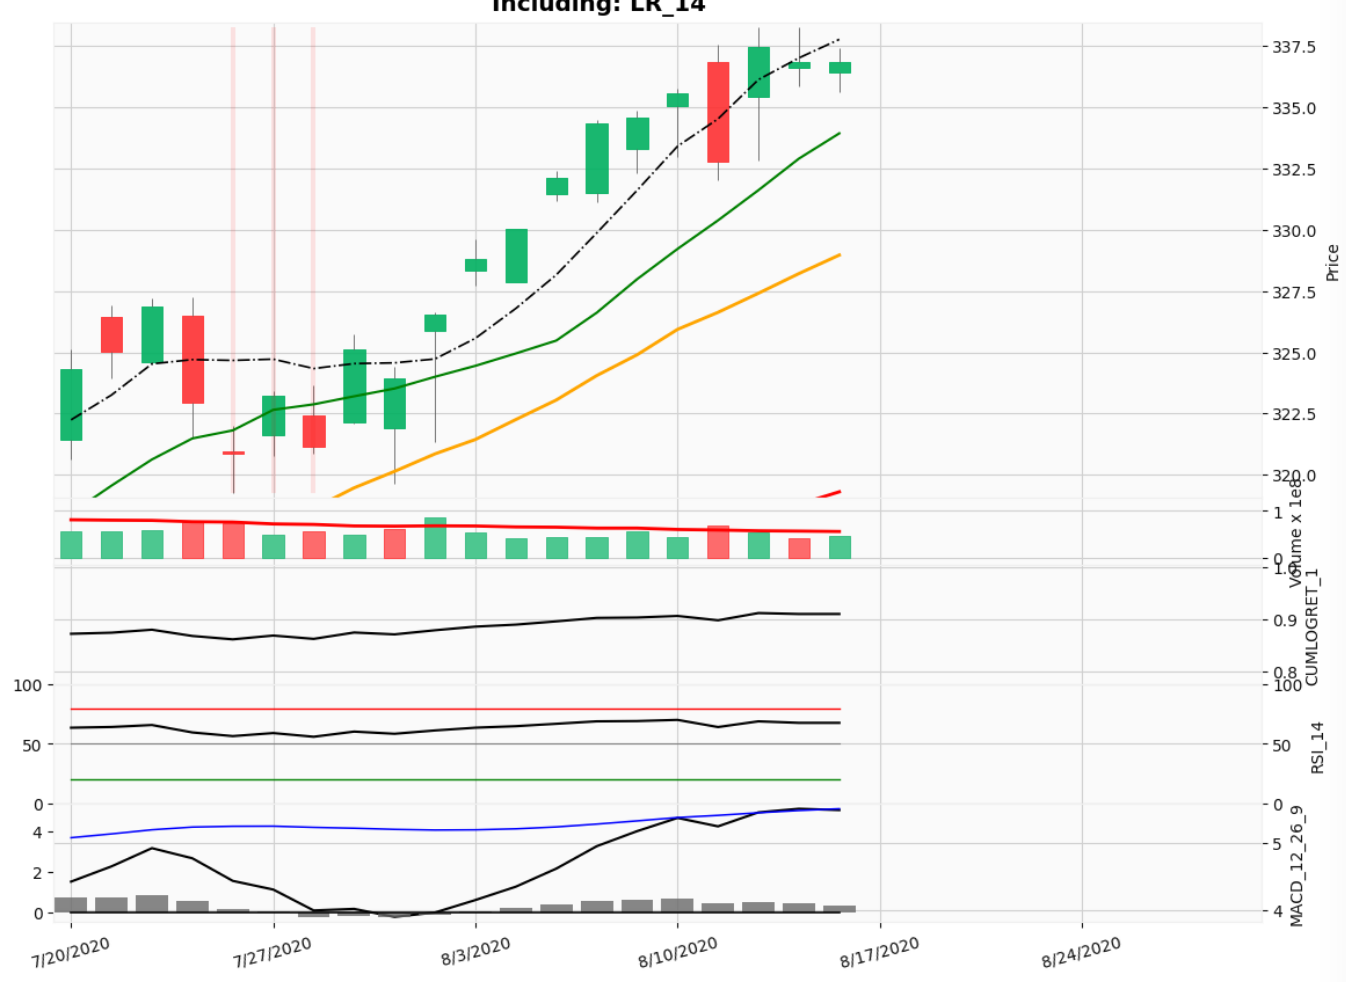
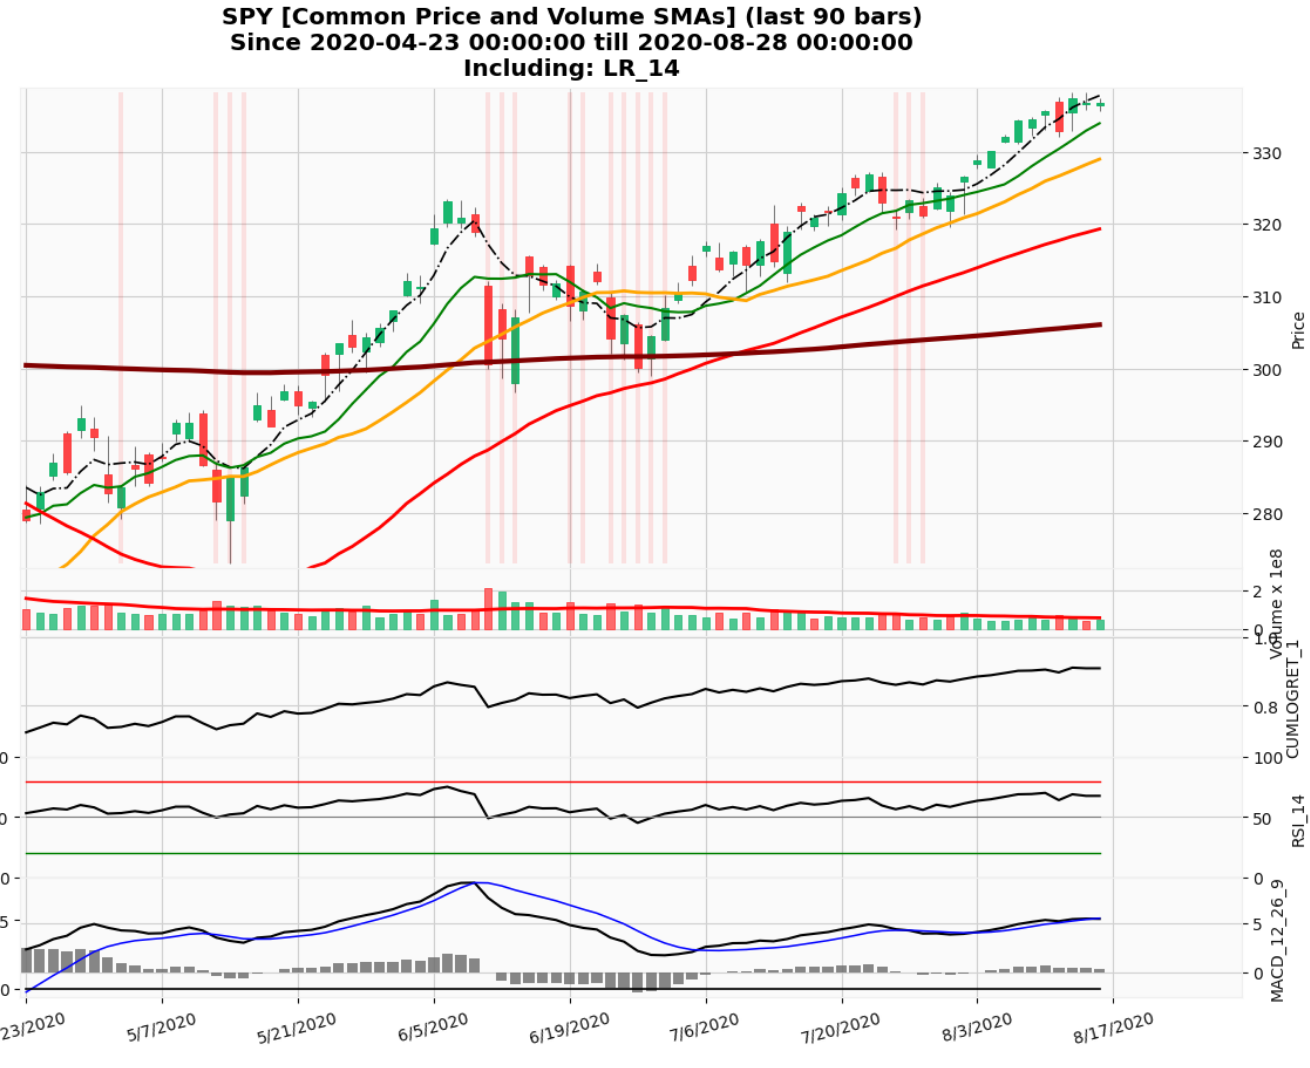
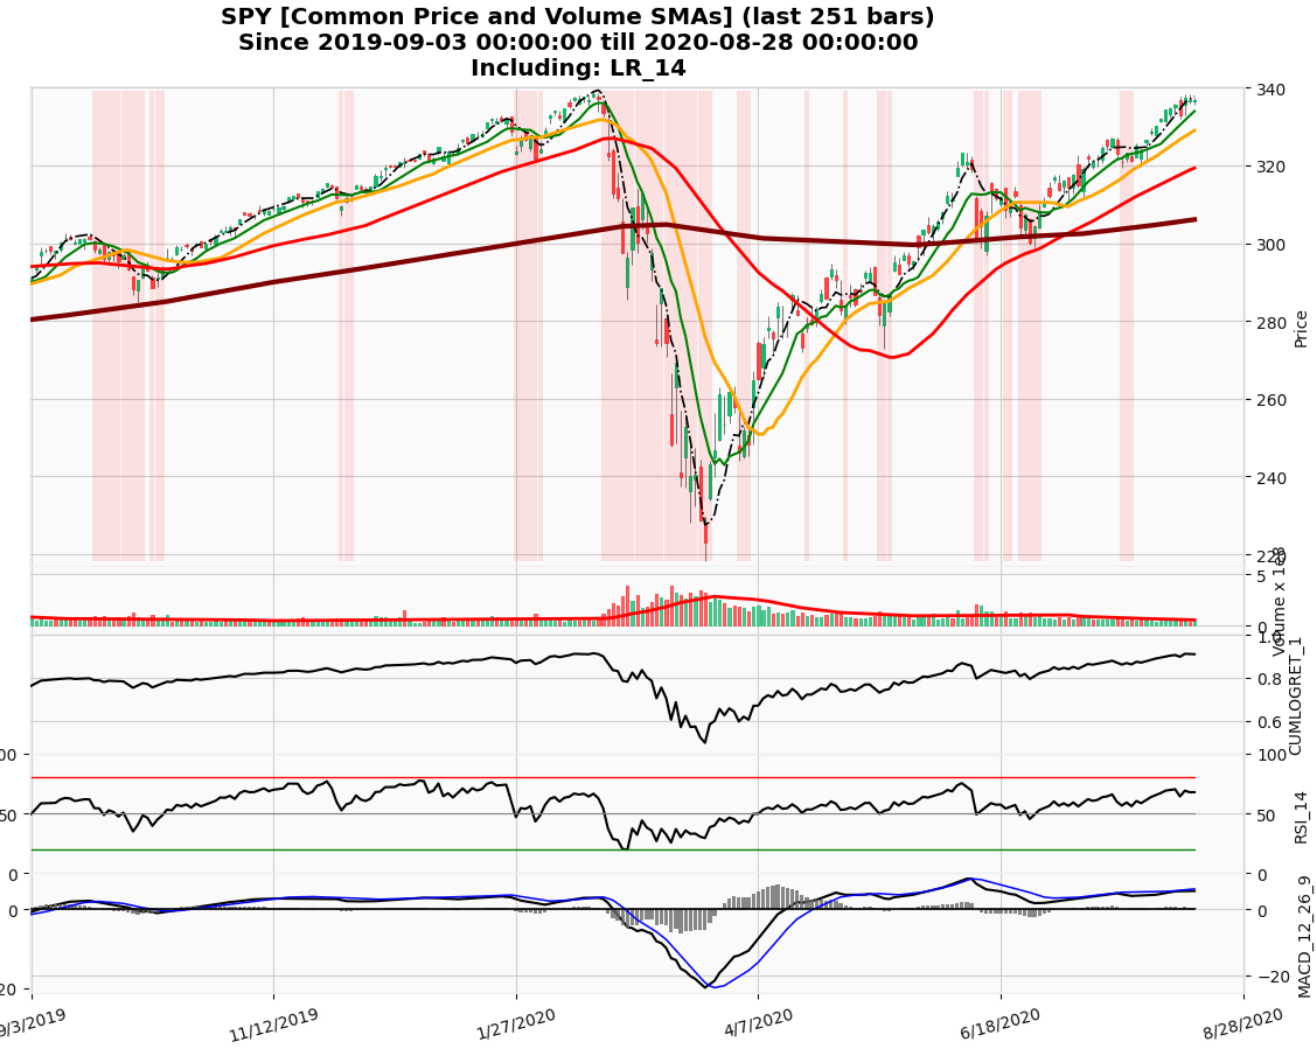
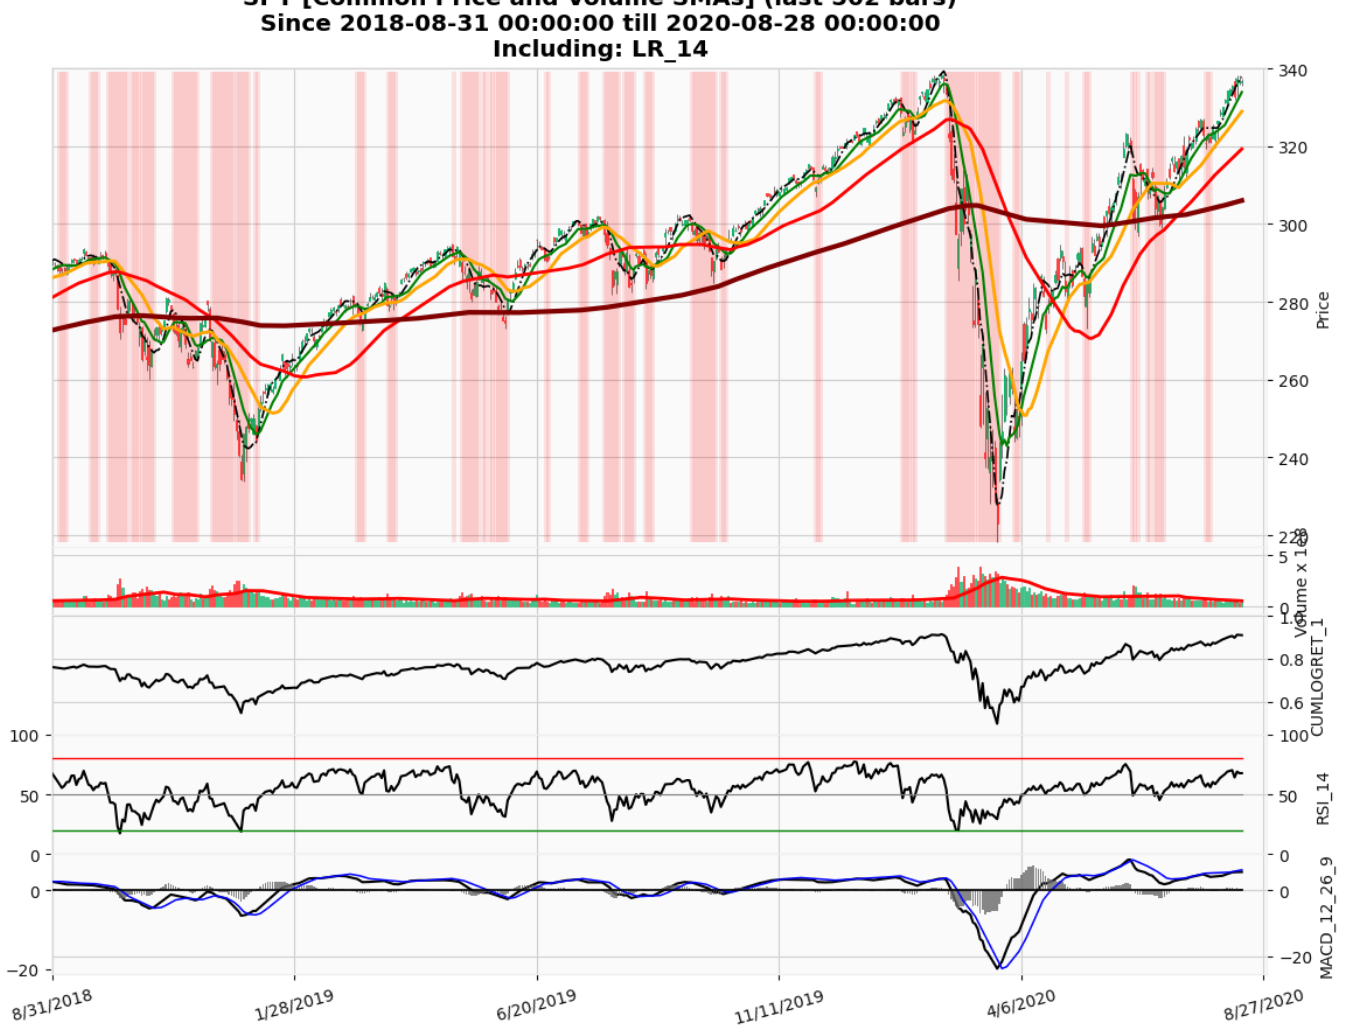
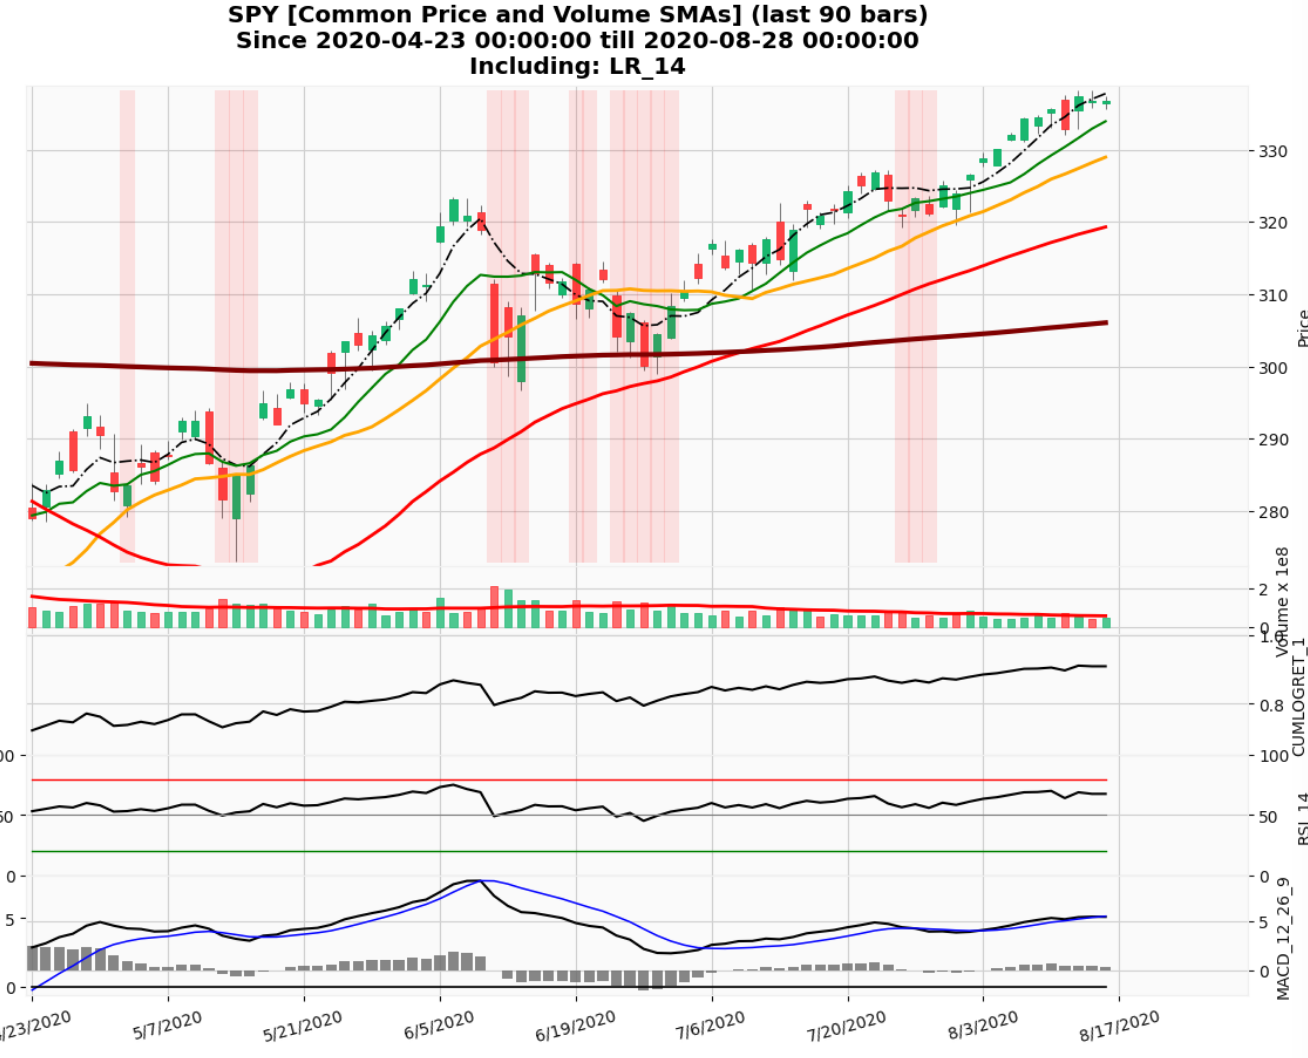
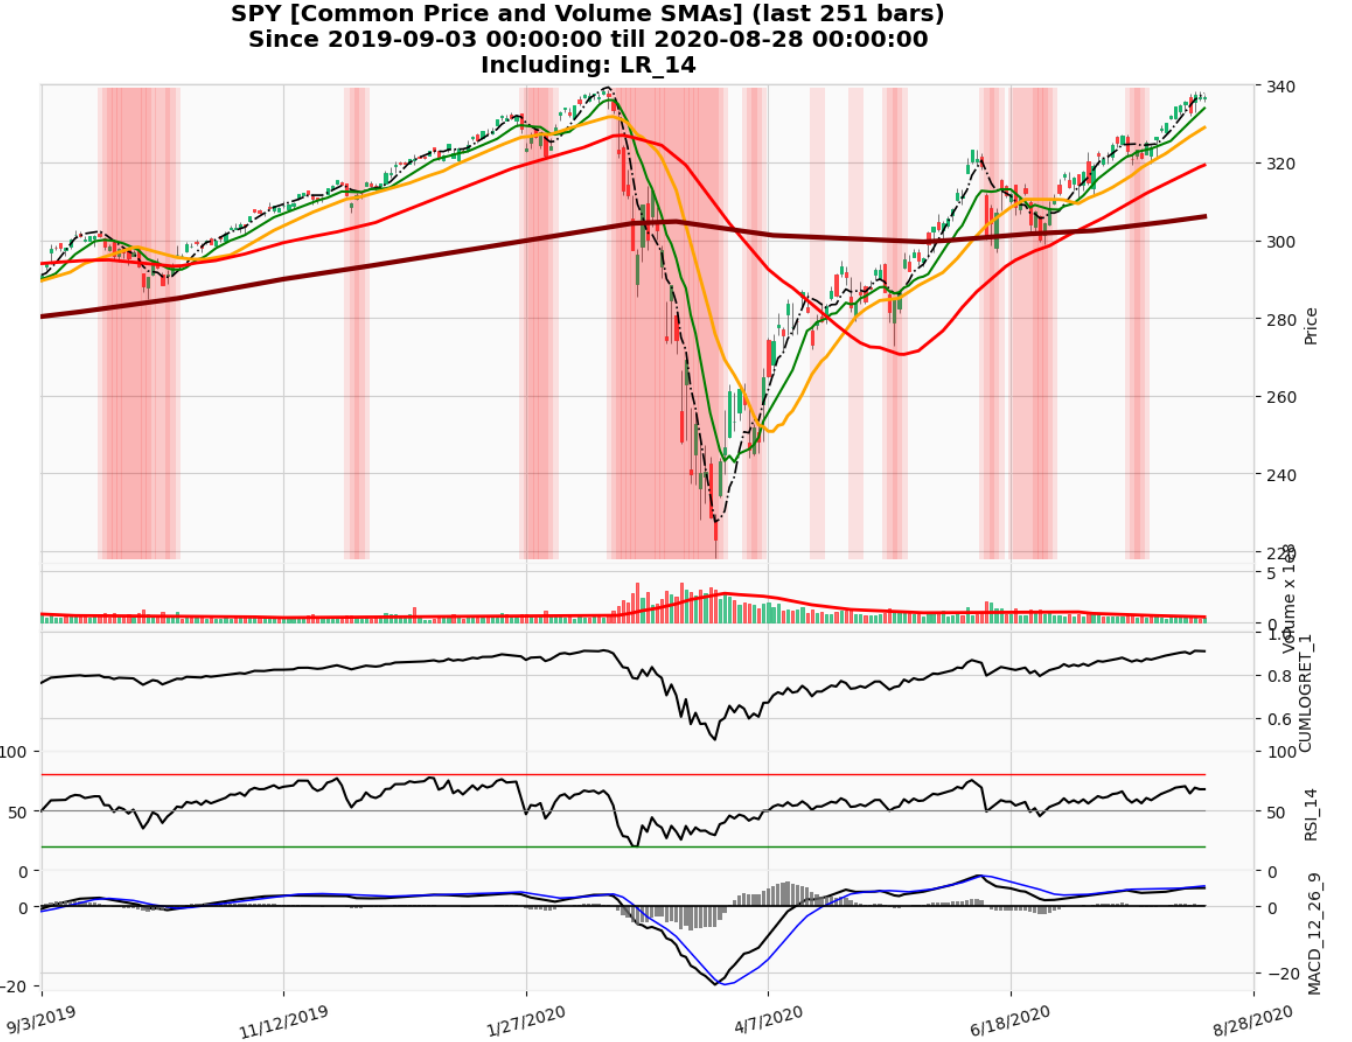
I like the _vlines_ but they sometimes overlap when ```linewidths >= 8``` or create gaps when ```linewidths < 8```. It's noticeable when the number of bars are plotted.
**Describe the solution you'd like**
* Either another argument to passed into _vlines_ so that there are no gaps or overlaps created.
* Or maybe something similar to _vlines_ that is more specific for this purpose as this feature is slightly different than the original purpose of _vlines_.
**Describe alternatives you've considered**
I have not checked if it works in **External Axes Mode**.
**Additional context**
I made a semi-dynamic Panels [Chart Class Example Notebook](https://github.com/twopirllc/pandas-ta/blob/master/examples/example.ipynb) for my **Pandas TA** Library. The _plot_ method is located at the bottom of _Input Cell 11_.
You can play around with the Chart class arguments, namely _last_ argument, in _Input Cell 12_ to see what I mean.
Here are some example chart outputs:
#### Gaps
```last = 30``` and no _linewidth_ argument used.
```last = 90``` and no _linewidth_ argument used.
```last = recent``` (recent = 251) and no _linewidth_ argument used.
```last = 2 * recent``` (recent = 502) and no _linewidth_ argument used.
```last = 30, linewidths=8```
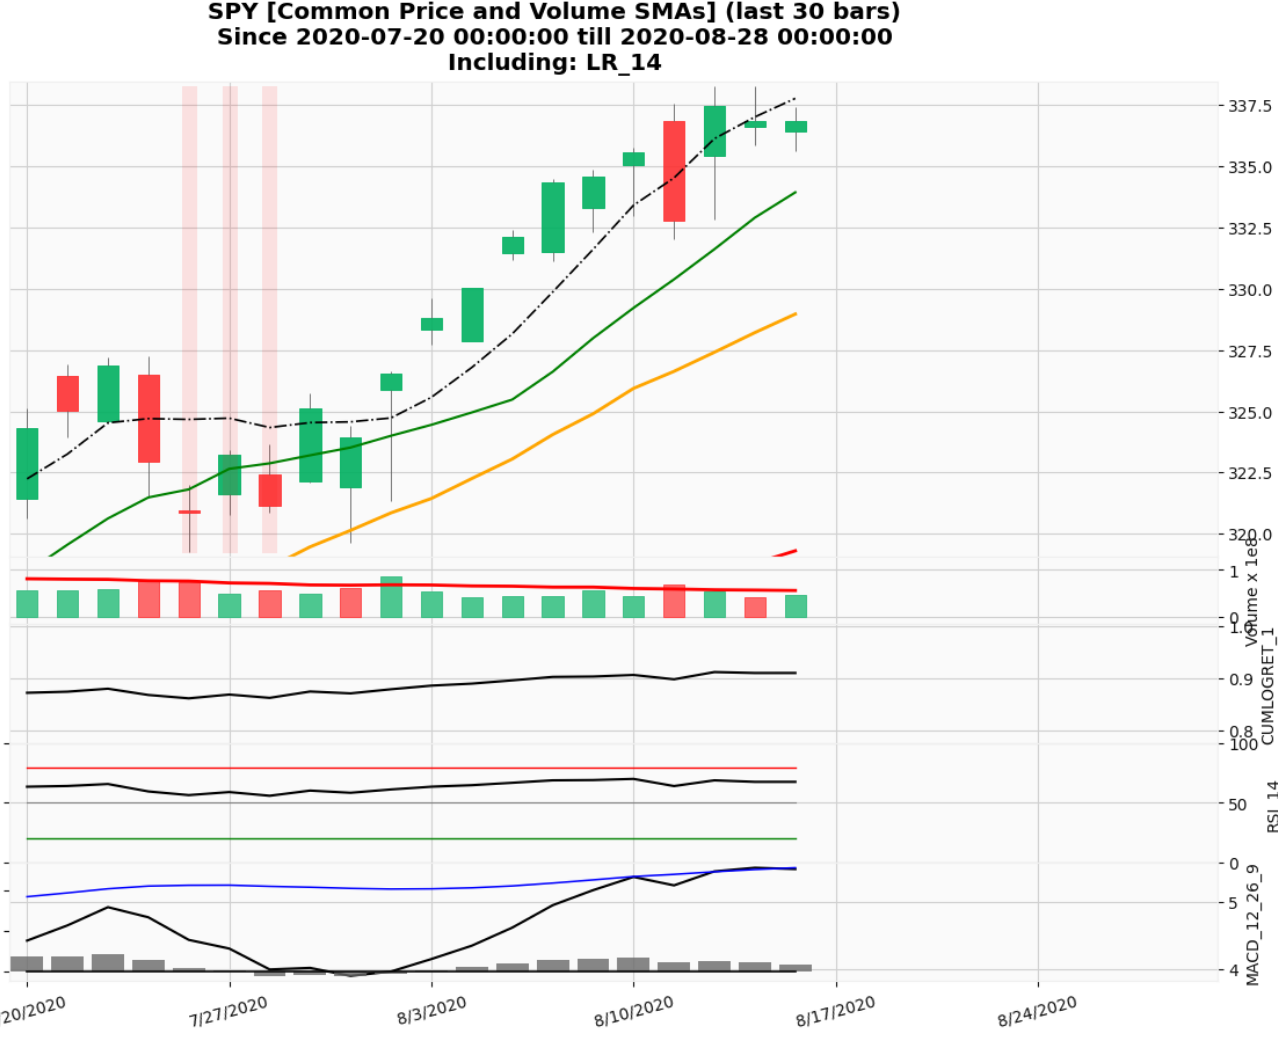
#### Overlap
```last = 90, linewidths=8```
```last = recent, linewidths=8```
Hope this helps!
Thanks for your time,
Kevin
Contributor guide
First steps
- Read the whole issue, then the project's contributing guide.
- Comment on the issue to say you are picking it up — it saves two people doing the same work.
- Fork the repository and make your change on a branch.
- Open a pull request that references the issue number.
Research direction
Start with examples/example.ipynb, especially the plot method in Input Cell 11 and the chart arguments in Input Cell 12. Reproduce the reported gaps and overlaps with different last values and linewidths, then determine a clear, tested behavior for candle spacing in both relevant plotting modes.
Written by the indexing model from the issue text.
Assessment
- Tech stack
- matplotlib, python
- Domain
- data-visualization
- Issue type
- Feature
- Difficulty
- 4/5
- Estimated time
- 3-5 days
- Activity status
- Stale
- Clarity
- Needs clarification
- Newbie friendliness
- 35/100