matplotlib / matplotlib/basemap
fillcontinents and aeqd projection
未关闭
还没有人认领这个 Issue。
- 主要语言
- Python
- 星标
- 817
- 派生
- 395
- PR 合并指标
- 30 天内没有已合并 PR
描述
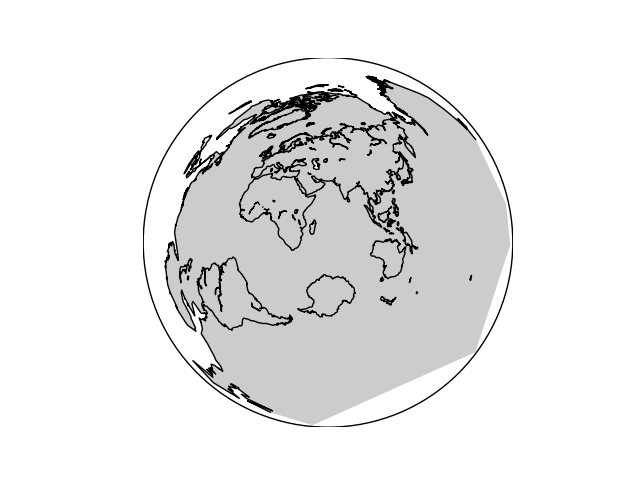
The fillcontinents routine seems to fill the ouside of the continents, not the inside under some specific lat/lon values. (basemap.__version__ = 1.1.0 from conda-forge)
import matplotlib.pyplot as plt
from mpl_toolkits.basemap import Basemap

clon, clat = 62.426312397000004, -34.6302096207
bmap = Basemap(projection='aeqd', lat_0=clat, lon_0=clon)

fig, ax = plt.subplots()

conts = bmap.fillcontinents(zorder=9)
conts = bmap.drawcoastlines(color='black', zorder=10)

plt.show()
贡献指南
这个仓库没有索引到贡献指南
从这里开始
- 先读完整个 Issue,再读项目的贡献指南。
- 在 Issue 下留言说明你要接手 —— 这能避免两个人做同样的事。
- Fork 仓库,在一个分支上完成修改。
- 提交 Pull Request,并在描述里引用这个 Issue 编号。
调研方向
首先,使用 aeqd 投影运行提供的 Python 示例,并检查 fillcontinents 和 drawcoastlines 入口点。根据提供的纬度和经度值,将填充区域与海岸线进行比较;当大陆在正确的一侧被填充,并且回归检查覆盖此情况时,该 issue 即完成。
由索引模型根据 Issue 内容生成。
评估
- 技术栈
- matplotlib, python
- 领域
- data-visualization
- Issue 类型
- 缺陷
- 难度
- 4/5
- 预计耗时
- 3-5 天
- 活跃度
- 停滞
- 描述清晰度
- 基本清楚
- 新手友好度
- 35/100