matplotlib / matplotlib/basemap
fillcontinents and aeqd projection
- Dominant language
- Python
- Stars
- 817
- Forks
- 395
- PR merge metrics
- No merged PRs in 30d
Description
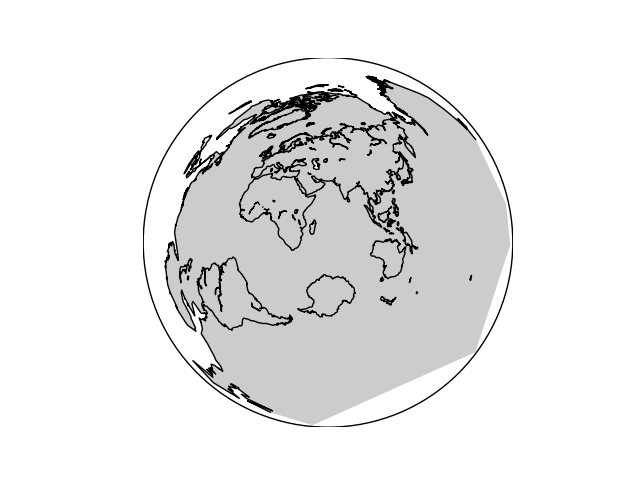
The `fillcontinents` routine seems to fill the ouside of the continents, not the inside under some specific lat/lon values. (`basemap.__version__ = 1.1.0` from `conda-forge`)
```
import matplotlib.pyplot as plt
from mpl_toolkits.basemap import Basemap
clon, clat = 62.426312397000004, -34.6302096207
bmap = Basemap(projection='aeqd', lat_0=clat, lon_0=clon)
fig, ax = plt.subplots()
conts = bmap.fillcontinents(zorder=9)
conts = bmap.drawcoastlines(color='black', zorder=10)
plt.show()
```
Contributor guide
No contributing guide indexed for this repository
Research direction
Start by running the provided Python example with the aeqd projection and inspect the fillcontinents and drawcoastlines entry points. Compare the filled regions with the coastline for the supplied latitude and longitude values; the issue is done when continents are filled on the correct side and a regression check covers this case.
Written by the indexing model from the issue text.
Assessment
- Tech stack
- matplotlib, python
- Domain
- data-visualization
- Issue type
- Bug
- Difficulty
- 4/5
- Estimated time
- 3-5 days
- Activity status
- Stale
- Clarity
- Mostly clear
- Newbie friendliness
- 35/100