jenkinsci / jenkinsci/coverage-plugin
[JENKINS-76204] Create a new view that shows the available metrics in an overview
- 主要语言
- Java
- 星标
- 40
- 派生
- 31
- 平均合并
- 5 天 17 小时
- 30 天内合并 PR
- 11
描述
As a starting point it makes sense to create a simple view that shows an overview of the quality metrics that are part of the coverage plugin. This view should be part of the coverage plugin and can be moved to the metrics-aggregation plugin later.

The new view should follow the design guidelines of the design library, especially:
- https://weekly.ci.jenkins.io/design-library/app-bars/
- https://weekly.ci.jenkins.io/design-library/layouts/
The new view should show the existing trend of the coverage plugin:
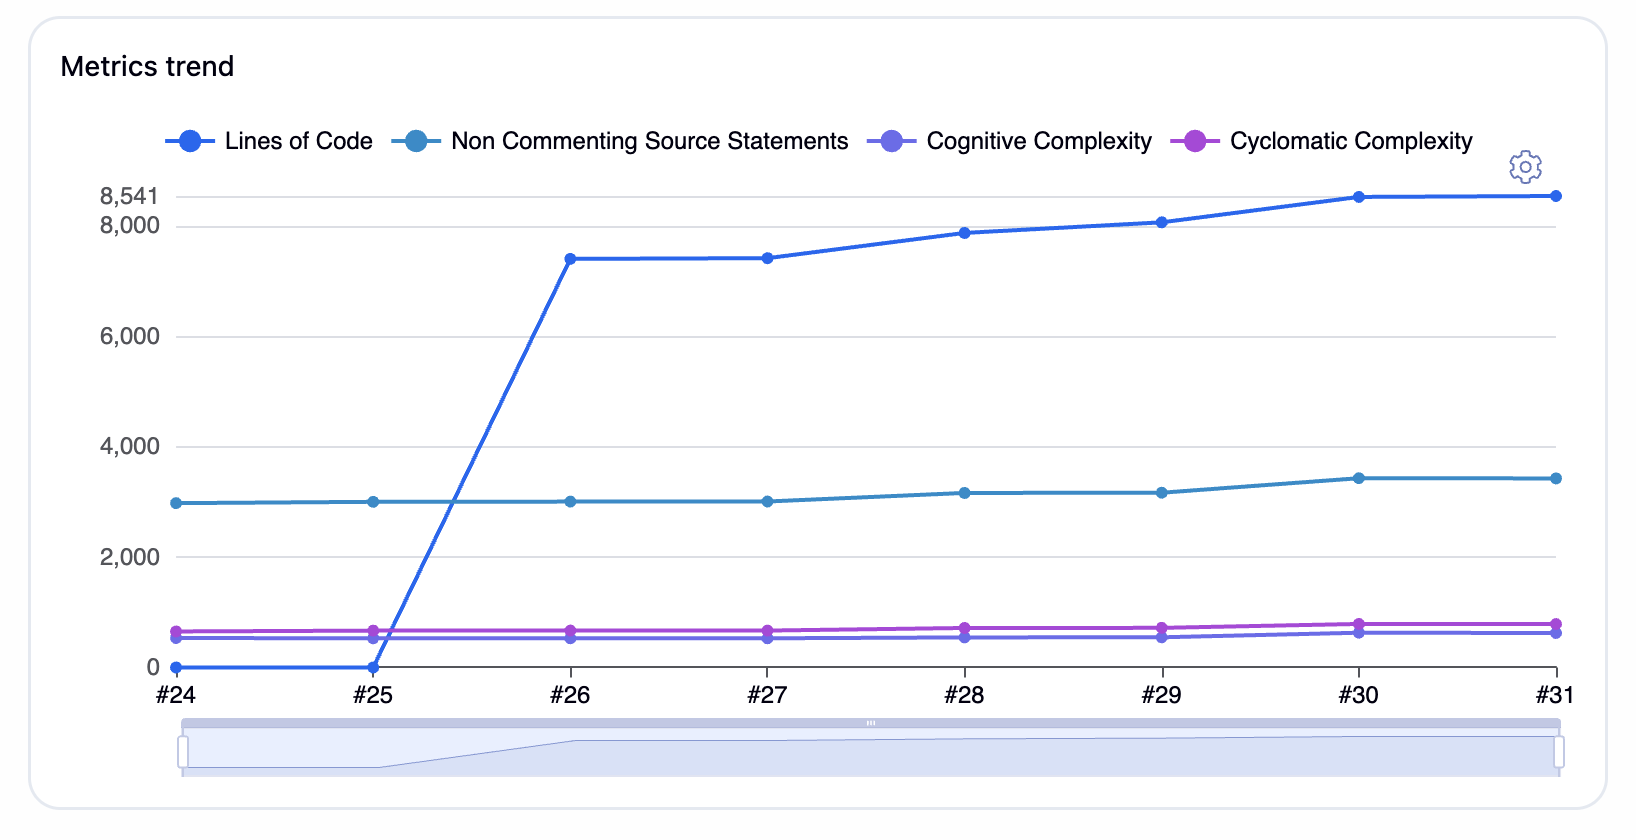
On the x-axis all available builds are visible. On the y-axis the overall value of the metric is shown (total in a project). In the first iteration, the visible metrics and the styling is hard-coded.
---
Originally reported by  drulli, imported from: Create a new view that shows the available metrics in an overview
Raw content of original issue
As a starting point it makes sense to create a simple view that shows an overview of the quality metrics that are part of the coverage plugin. This view should be part of the coverage plugin and can be moved to the metrics-aggregation plugin later.
The new view should follow the design guidelines of the design library, especially:
- https://weekly.ci.jenkins.io/design-library/app-bars/
- https://weekly.ci.jenkins.io/design-library/layouts/
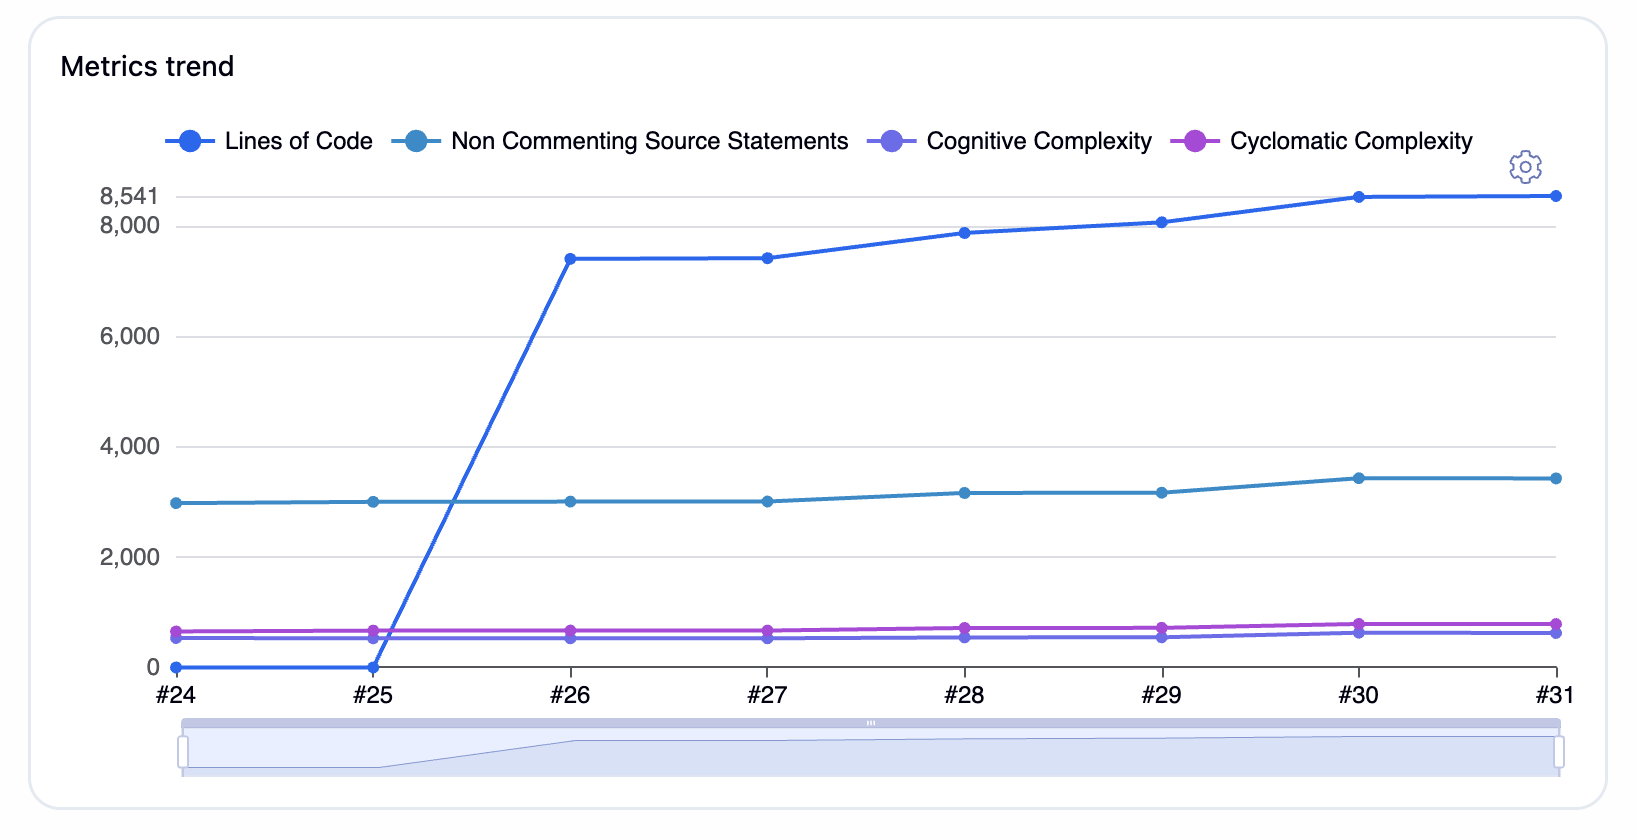
The new view should show the existing trend of the coverage plugin:
On the x-axis all available builds are visible. On the y-axis the overall value of the metric is shown (total in a project). In the first iteration, the visible metrics and the styling is hard-coded.
1 attachment
- [Bildschirmfoto 2025-10-15 um 09.18.07.png](https://issues.jenkins.io/secure/attachment/64984/Bildschirmfoto%202025-10-15%20um%2009.18.07.png)
> 
贡献指南
调研方向
未指定文件或测试。首先定位 coverage plugin 现有的趋势视图以及用于添加插件视图的入口点,然后将提议的布局与链接的 design-library 指南进行比较。完成标准是:coverage plugin 的视图能够显示现有趋势在可用 builds 中的情况,并使用硬编码的可见指标和样式。
由索引模型根据 Issue 内容生成。
评估
- 技术栈
- java
- 领域
- frontend
- Issue 类型
- 功能
- 难度
- 4/5
- 预计耗时
- 3-5 天
- 活跃度
- 停滞
- 描述清晰度
- 基本清楚
- 新手友好度
- 35/100