add relational diagrams for example datasets
Open
Nobody has claimed this yet.
documentation
- Dominant language
- Jupyter Notebook
- Stars
- 55
- Forks
- 24
- PR merge metrics
- No merged PRs in 30d
Description
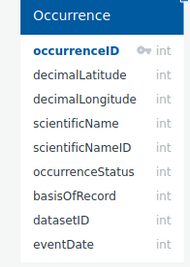
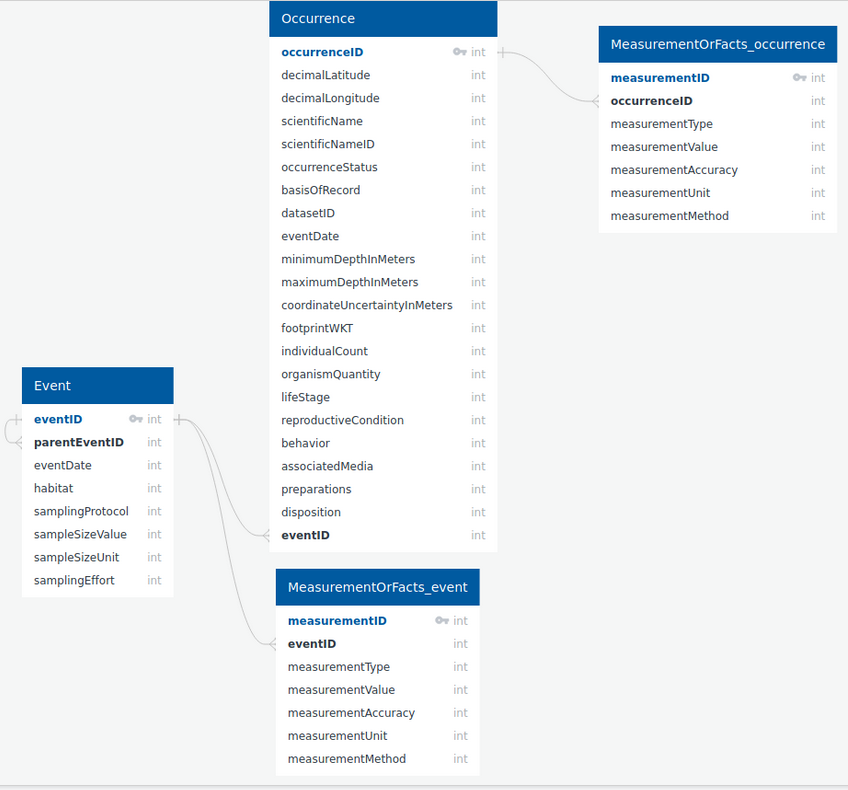
I have previously used quickDBD to create diagrams of how the occurence, MoF, event, etc files/tables connect with each other. I find these views tremendously useful and would like to encourage including them for the example datasets.
Then again... does anyone else find database diagrams useful or is it just me?
bare-minimum example (tier 0):
more detailed example:
Contributor guide
First steps
- Read the whole issue, then the project's contributing guide.
- Comment on the issue to say you are picking it up — it saves two people doing the same work.
- Fork the repository and make your change on a branch.
- Open a pull request that references the issue number.
Research direction
Review the example dataset files and tables referenced in the issue, then compare the bare-minimum and more detailed quickDBD examples to determine the appropriate coverage. Done means relational diagrams are added for the example datasets and clearly show how the occurrence, MoF, event, and related tables connect.
Written by the indexing model from the issue text.
Assessment
- Domain
- databases, documentation
- Issue type
- Feature
- Difficulty
- 4/5
- Estimated time
- 3-5 days
- Activity status
- Stale
- Clarity
- Mostly clear
- Newbie friendliness
- 25/100