Improve UX when features aren't supported in the current run-mode
- 主要语言
- Dart
- 星标
- 1.7k
- 派生
- 404
- 平均合并
- 6 天 17 小时
- 30 天内合并 PR
- 18
描述
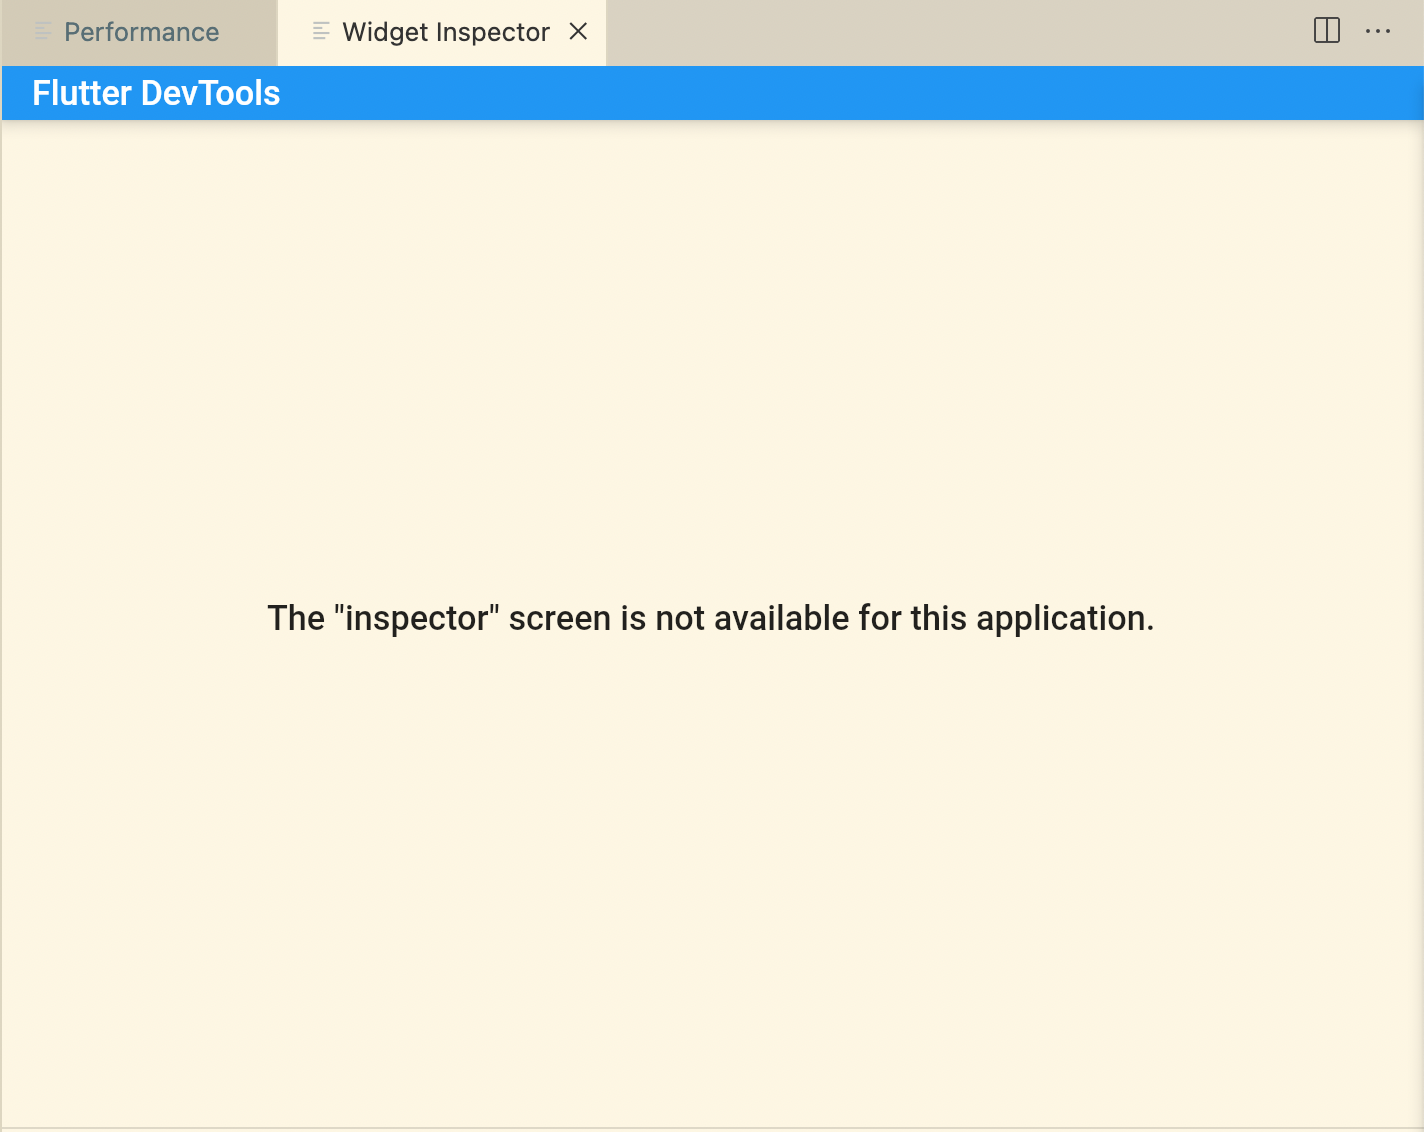
It's not clear what DevTools the user is allowed to open and when. For example, if a user is running in profile mode and tries to run the "Open Widget Inspector" command in VSCode they are shown this screen:
It seems like that most things are supported in Debug and Profile mode, but show inconsistent messages:
| | Debug | Profile | Release |
|---|---|---|---|
| Widget Inspector | 🟢 | 🔴 | 🔴 |
| CPU Profiler | 🔴 | 🟢 | 🔴 |
| Memory Page | 🟡 | 🟢 | 🔴 |
| Performance Page | 🔴 | 🟢 | 🔴 |
| Network Page | 🟢 | 🟢 | 🔴 |
| Logging Page | 🟢 | 🟢 | 🔴 |
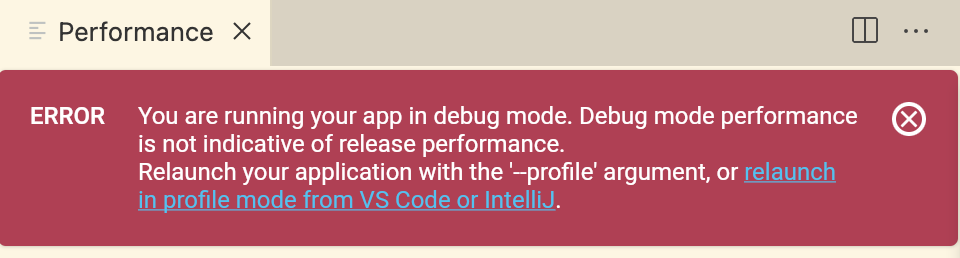
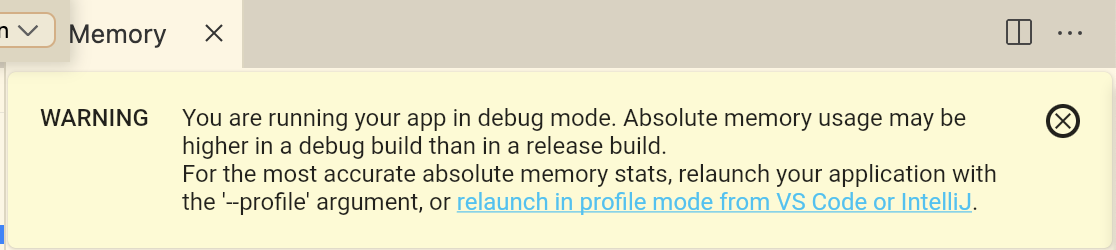
For example, when running in debug mode, the toast messages for the CPU Profiler, Memory, and Performances pages are inconsistent. The memory page displays a warning but the CPU Profiler and Performance pages display an error:
If you try to open a DevTools panel in release mode, you get a warning like this, but I'm also wondering if we could clarify this message:

cc: @kenzieschmoll @DanTup
贡献指南
评估
这个 Issue 还没有评估数据。