Allow **kwargs parameter to be passed in plotting utils
- Vorherrschende Sprache
- Python
- Sterne
- 850
- Forks
- 96
- PR-Merge-Kennzahlen
- Keine gemergten PRs in 30 T.
Beschreibung
Hi,
At the moment plotting utils do not accept **kwargs param for plotly charting functionality. As such, there is no ability for end-users to control the theme and other aspects of the chart.
**Example:**
```
class RFBinaryClassificationPipeline(evalml.pipelines.BinaryClassificationPipeline):
component_graph = ['Simple Imputer', 'Random Forest Classifier']
pipeline = RFBinaryClassificationPipeline({})
pipeline.fit(X, y)
pipeline.graph_feature_importance(template = 'plotly_dark')
```
The last line here because of the `template` param will return an error. Without the `template` param, it will generate the plot:
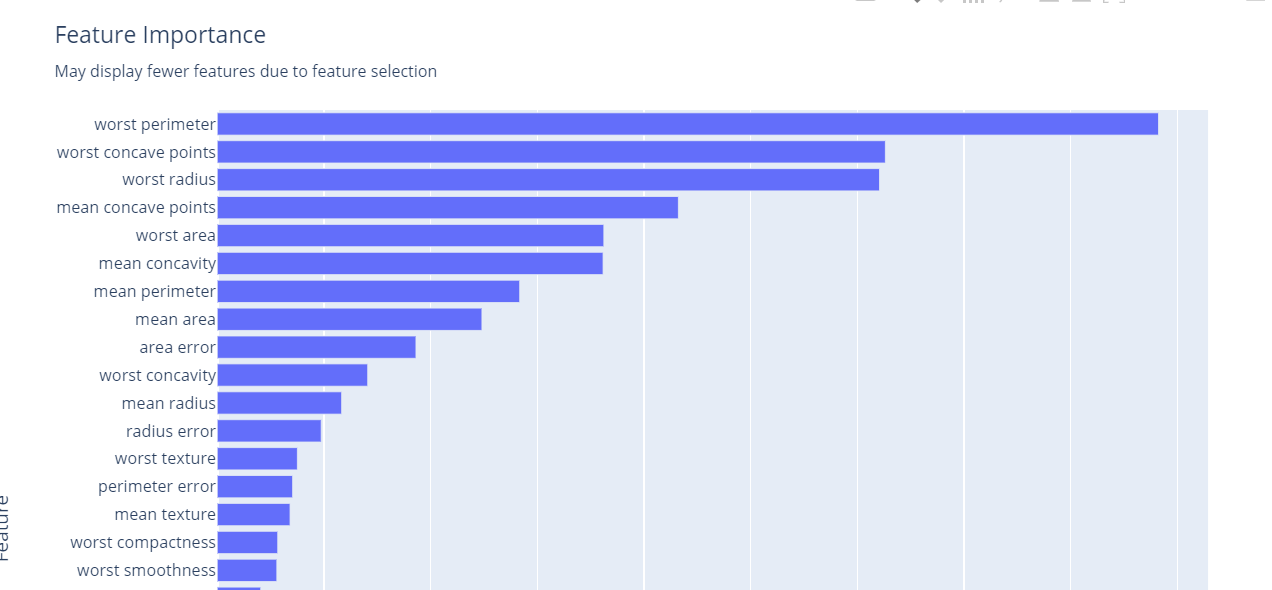
However, it will be a great idea to give the ability to users to control the esthetics as it helps them to better integrate charting functionality within their workflows (Think about somebody building a front-end streamlit or Flask app and want's to use charting functionality of EvalML, without the flexibility they won't be able to control theme).
I have reproduced a similar graph using plotly with the dark theme just to show an example:
```
f = pipeline.feature_importance
import plotly.express as px
fig = px.bar(f, x='feature', y='importance', template = 'plotly_dark')
fig.show()
```
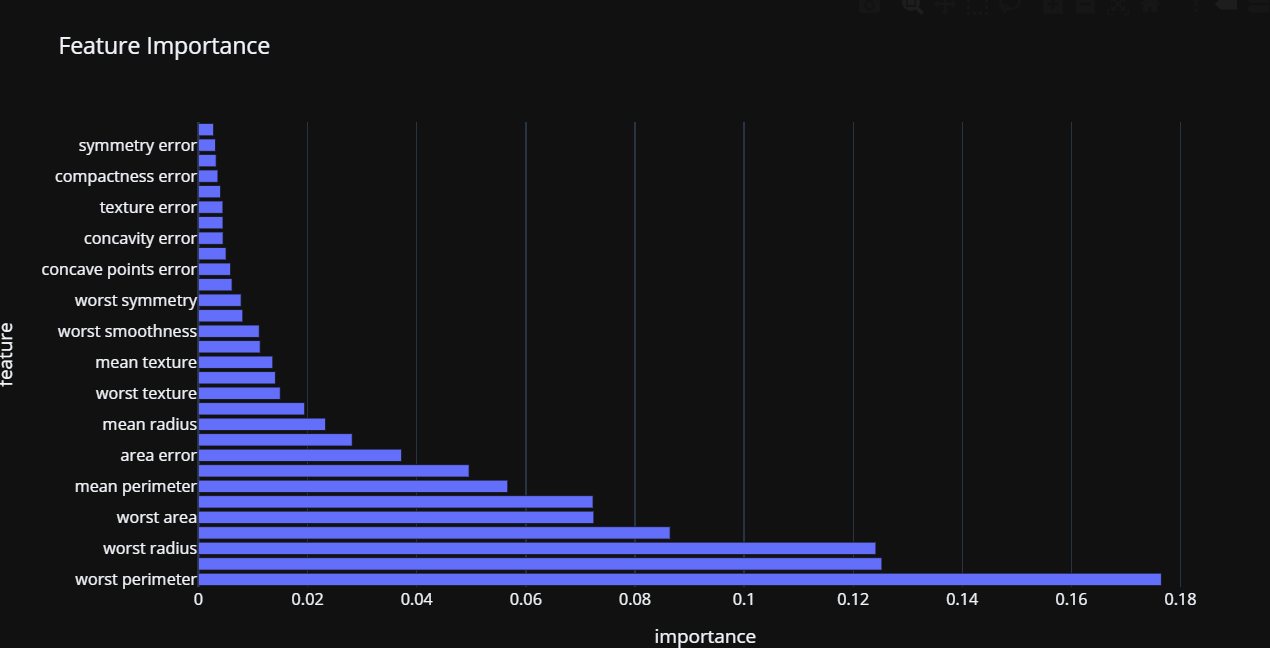
Sorry, the sort order is off here, it should actually be reverse (highest features appearing on top).
You can either pick few params from plotly and include them in your plotting utils such as `template`, `fact`, `color`, `range`, etc., or even better is to allow users to pass any plotly parameter as **kwargs.
Beitragsleitfaden
Bewertung
Dieses Issue wurde noch nicht bewertet.