allisonhorst / allisonhorst/palmerpenguins
User-contributed data visualization #TidyTuesday
Offen
- Vorherrschende Sprache
- R
- Sterne
- 1k
- Forks
- 252
- PR-Merge-Kennzahlen
- Keine gemergten PRs in 30 T.
Beschreibung
Scatterplot and raincloud plots showing bill dimensions.
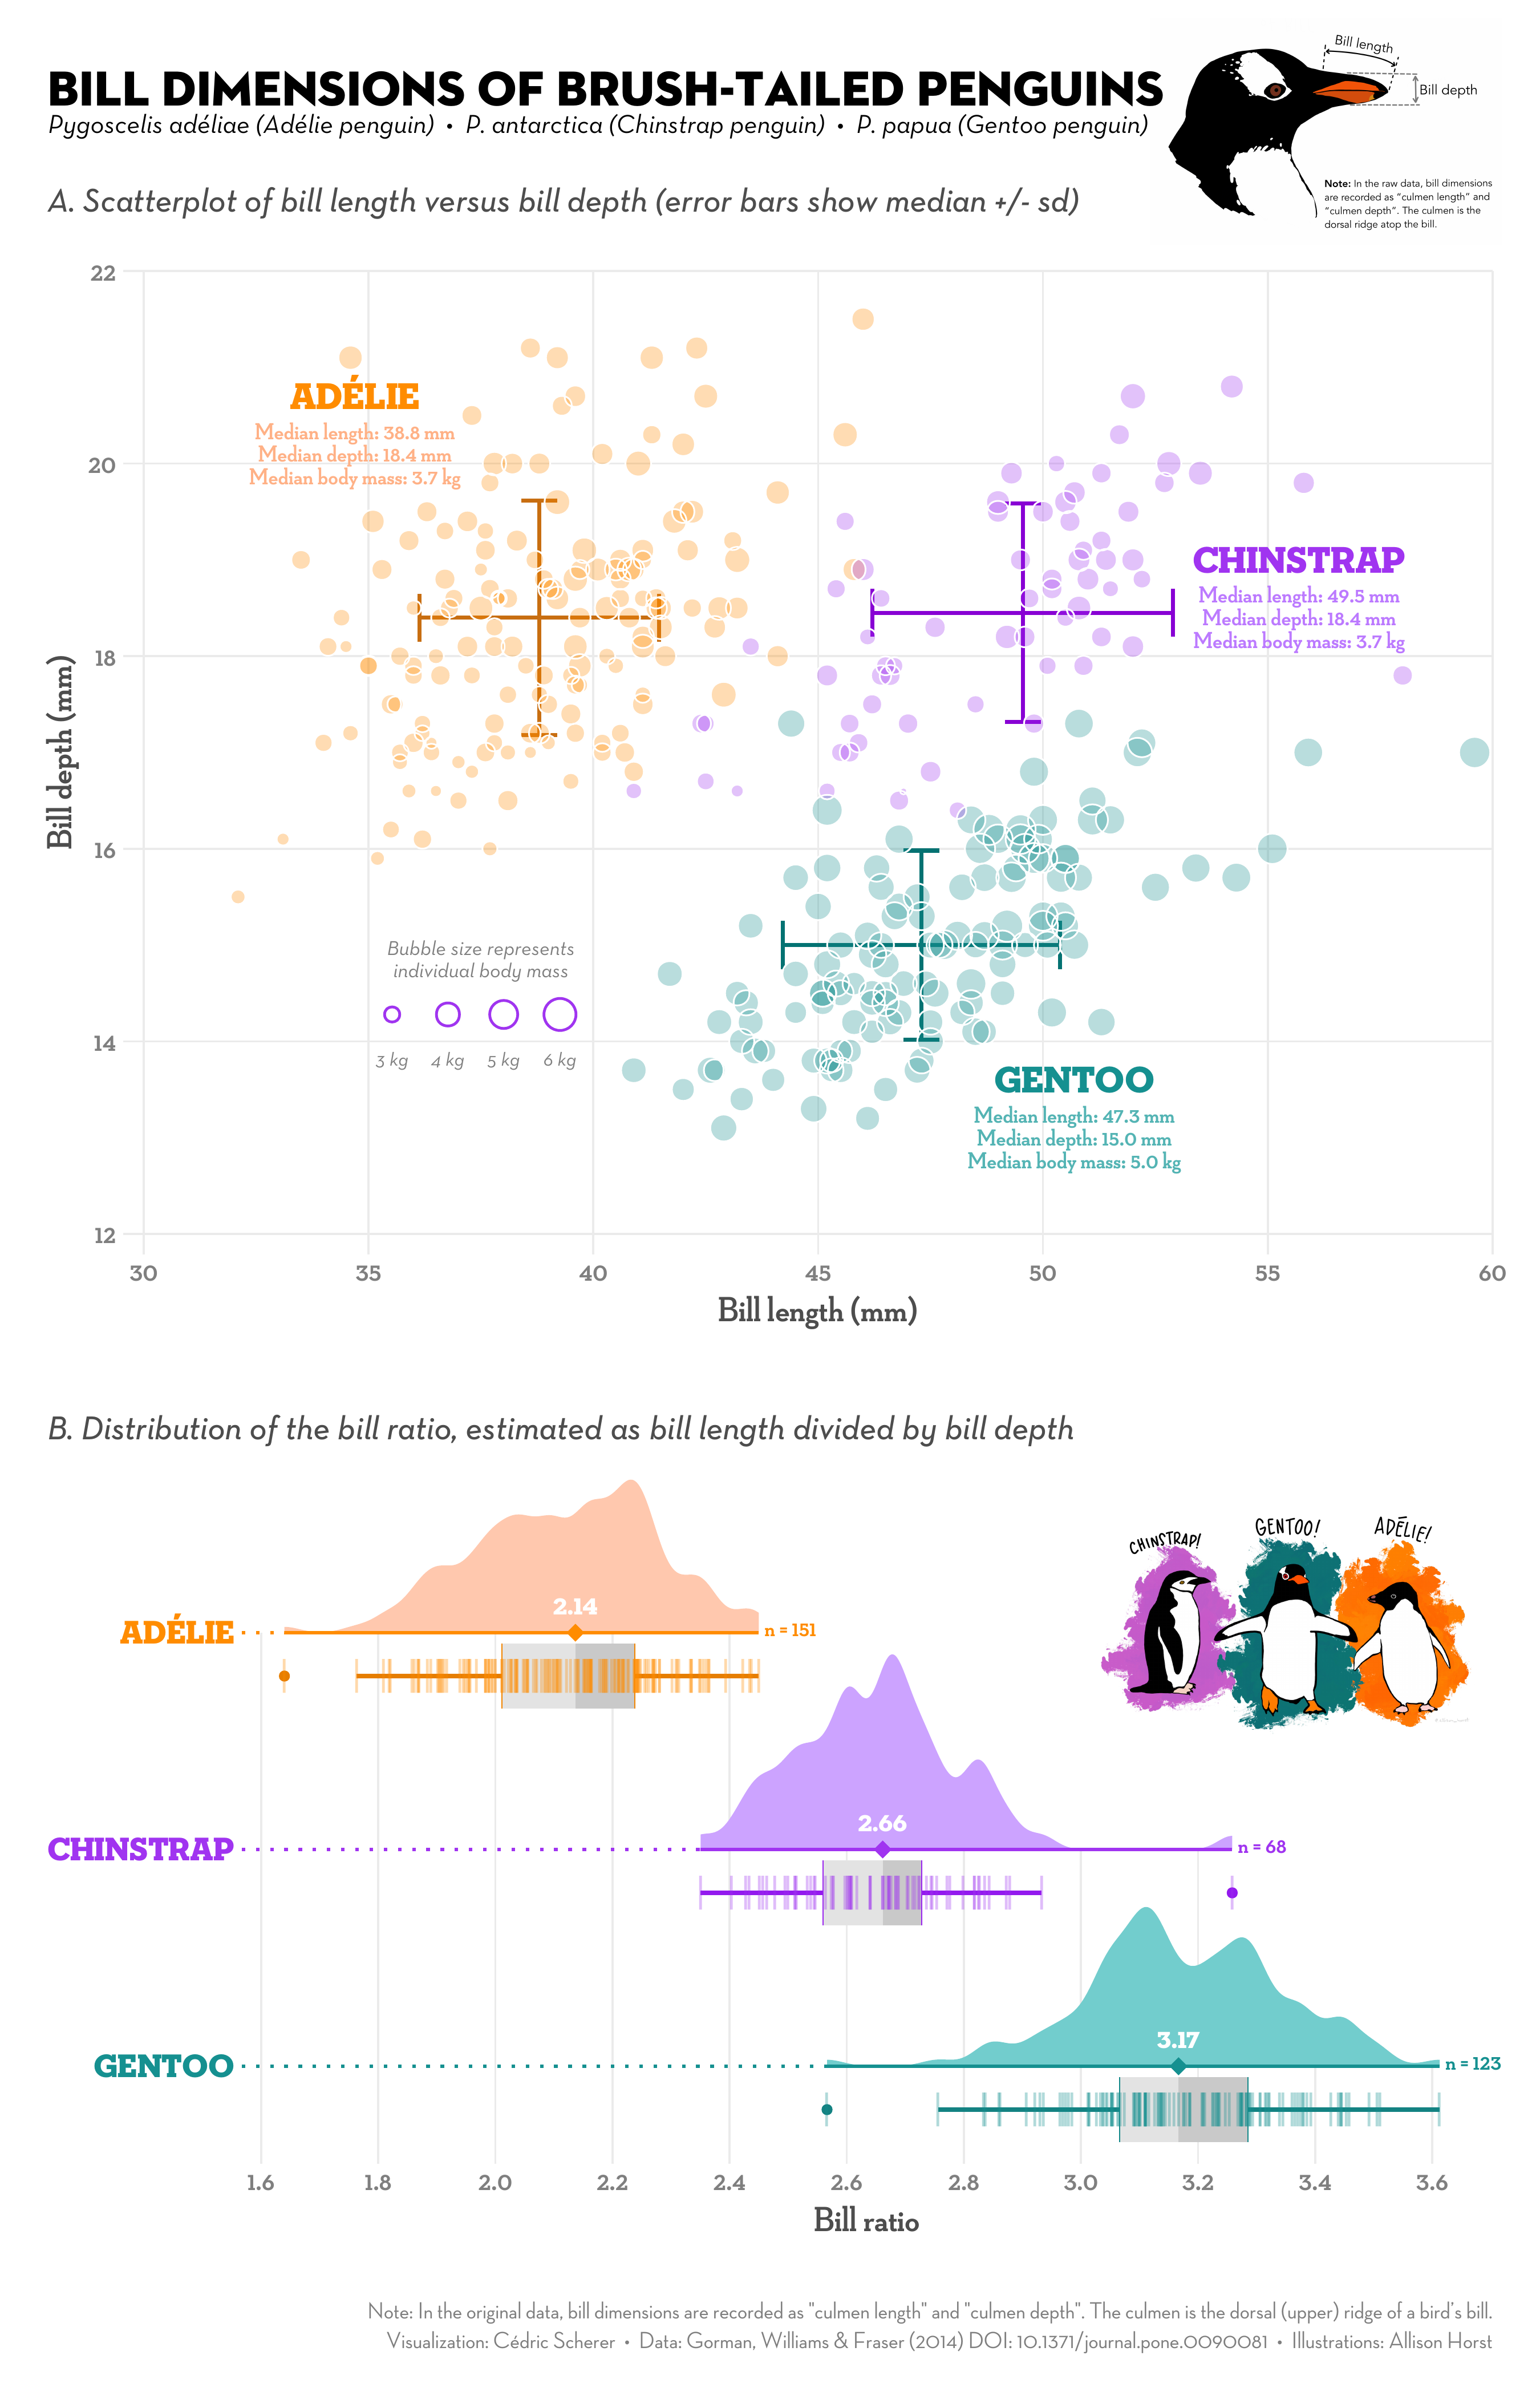
Visualization by Cédric Scherer, artwork by Allison Horst
The visualization shows the relationship of bill lengthg versus bill depth for the three brush-tailed penguins as well as the distribution of bill ratio, estimated as bill length divided by bill depth, as raincloud plots. All 100% ggplot2 as a #TidyTuesday contribution for week 2020/31.
Beitragsleitfaden
Für dieses Repository ist kein Beitragsleitfaden indexiert
Bewertung
Dieses Issue wurde noch nicht bewertet.