allisonhorst / allisonhorst/palmerpenguins
User-contributed data visualization #TidyTuesday
Ouverte
- Langage dominant
- R
- Étoiles
- 1k
- Forks
- 252
- Métriques de merge des PR
- Aucune PR mergée en 30 j
Description
Scatterplot and raincloud plots showing bill dimensions.
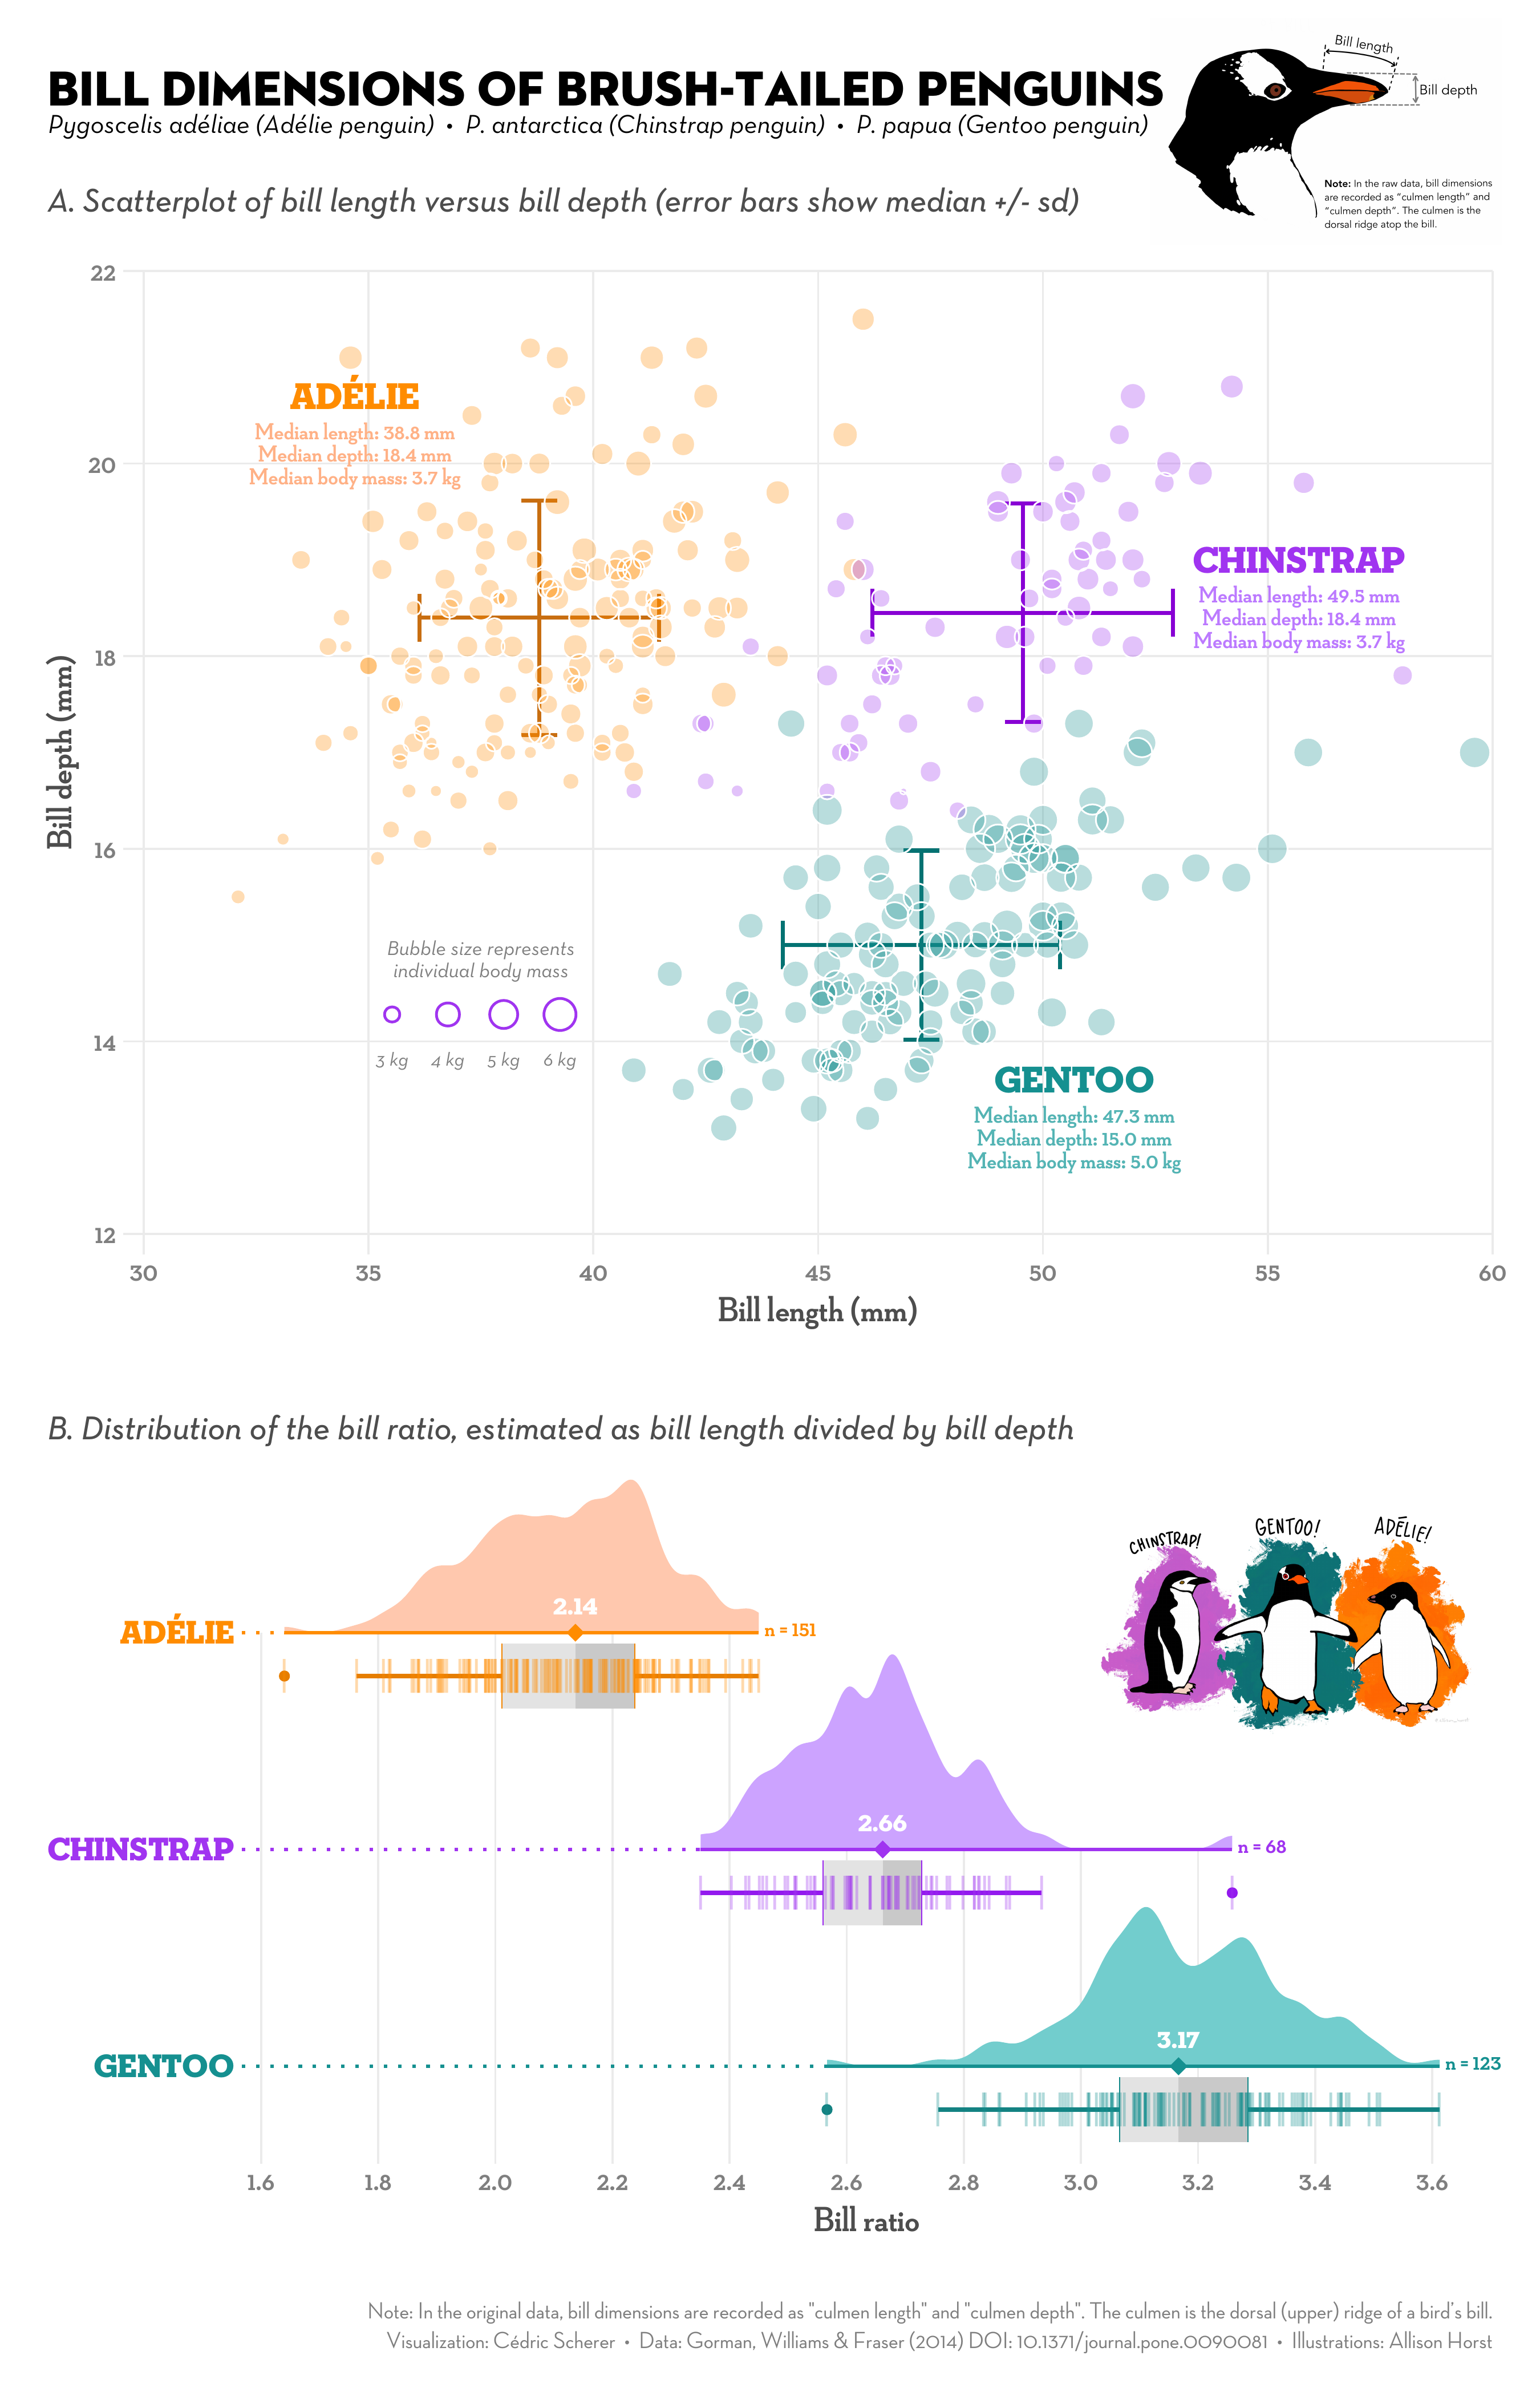
Visualization by Cédric Scherer, artwork by Allison Horst
The visualization shows the relationship of bill lengthg versus bill depth for the three brush-tailed penguins as well as the distribution of bill ratio, estimated as bill length divided by bill depth, as raincloud plots. All 100% ggplot2 as a #TidyTuesday contribution for week 2020/31.
Guide de contribution
Aucun guide de contribution indexé pour ce dépôt
Évaluation
Cette issue n'a pas encore été évaluée.