Chapter 02 California state image colorbar
- Lenguaje dominante
- Jupyter Notebook
- Estrellas
- 30k
- Forks
- 13.1k
- Métricas de merge de PR
- Sin PR fusionados en 30 d
Descripción
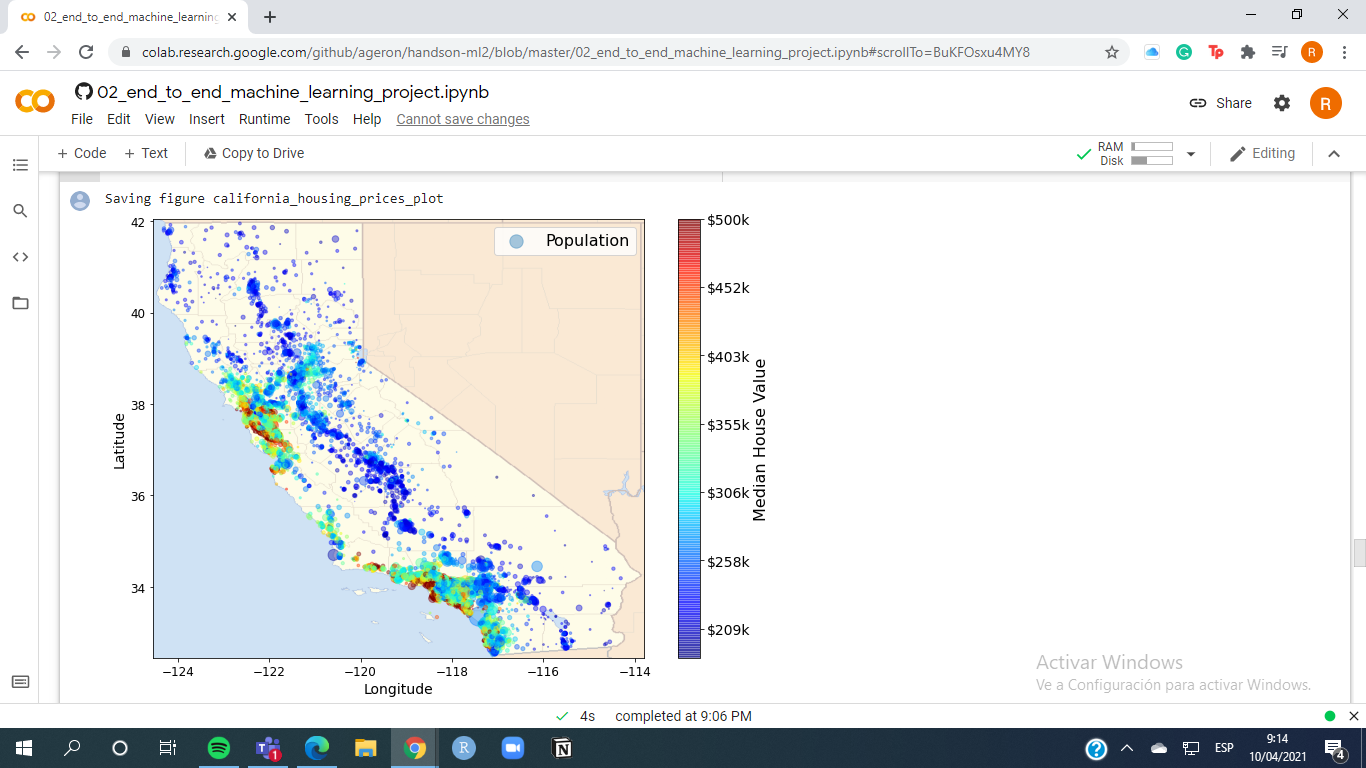
Hello! I was wondering why not all the tick labels are showing on the colorbar, just the last 7.
This is the part of the code that I extracted from Colab:
```python
import matplotlib.image as mpimg
california_img=mpimg.imread(os.path.join(images_path, filename))
ax = housing.plot(kind="scatter", x="longitude", y="latitude", figsize=(10,7),
s=housing['population']/100, label="Population",
c="median_house_value", cmap=plt.get_cmap("jet"),
colorbar=False, alpha=0.4)
plt.imshow(california_img, extent=[-124.55, -113.80, 32.45, 42.05], alpha=0.5,
cmap=plt.get_cmap("jet"))
plt.ylabel("Latitude", fontsize=14)
plt.xlabel("Longitude", fontsize=14)
prices = housing["median_house_value"]
tick_values = np.linspace(prices.min(), prices.max(), 11)
cbar = plt.colorbar(ticks=tick_values/prices.max())
cbar.ax.set_yticklabels(["$%dk"%(round(v/1000)) for v in tick_values], fontsize=14)
cbar.set_label('Median House Value', fontsize=16)
plt.legend(fontsize=16)
save_fig("california_housing_prices_plot")
plt.show()
```
This the output shown on the Colab:
Guía de contribución
No hay ninguna guía de contribución indexada para este repositorio
Evaluación
Este issue todavía no se ha evaluado.