CodingTrain / CodingTrain/Suggestion-Box
Coding challenge: plotter in p5.js
- Vorherrschende Sprache
- Keine Sprachdaten
- Sterne
- 570
- Forks
- 85
- PR-Merge-Kennzahlen
- Keine gemergten PRs in 30 T.
Beschreibung
I'd like to see a coding challenge in JavaScript about quadratic functions (https://en.wikipedia.org/wiki/Quadratic_function) and how you can create a cartesian coordinate system (https://en.wikipedia.org/wiki/Cartesian_coordinate_system) in combination with eachother.
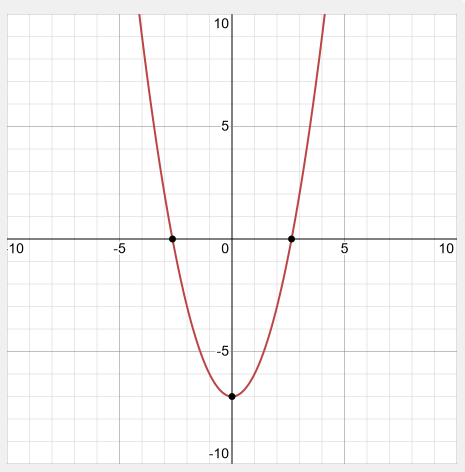
The function notation is for example: _f(x) = x² -7_, and the formula should be: _y = x² - 7 _.
And then you should be able to draw a cartesian coordinate system with this numbers. (See enclosure)
**EDIT:**
Not specific a quadratic function but just to draw a plotter.
Beitragsleitfaden
Für dieses Repository ist kein Beitragsleitfaden indexiert
Rechercherichtung
The issue names no repository files, tests, or entry points. Start by checking how CodingTrain challenge suggestions are organized, then define the scope for a JavaScript plotter challenge with Cartesian axes and the example y = x² - 7; done means the challenge format and expected plotting behavior are agreed.
Vom Indexierungsmodell aus dem Issue-Text verfasst.
Bewertung
- Tech-Stack
- javascript
- Bereich
- computer-graphics
- Issue-Typ
- Feature
- Schwierigkeit
- 5/5
- Geschätzter Aufwand
- Über eine Woche
- Aktivitätsstatus
- Veraltet
- Klarheit
- Muss geklärt werden
- Anfängerfreundlichkeit
- 25/100