Azure / Azure/MachineLearningNotebooks
Visualizations with BokehJS are doubling
- 主要语言
- Jupyter Notebook
- 星标
- 4.4k
- 派生
- 2.6k
- PR 合并指标
- 30 天内没有已合并 PR
描述
Today when booting up my ML environment, I am seeing a doubling of Bokeh visuals:

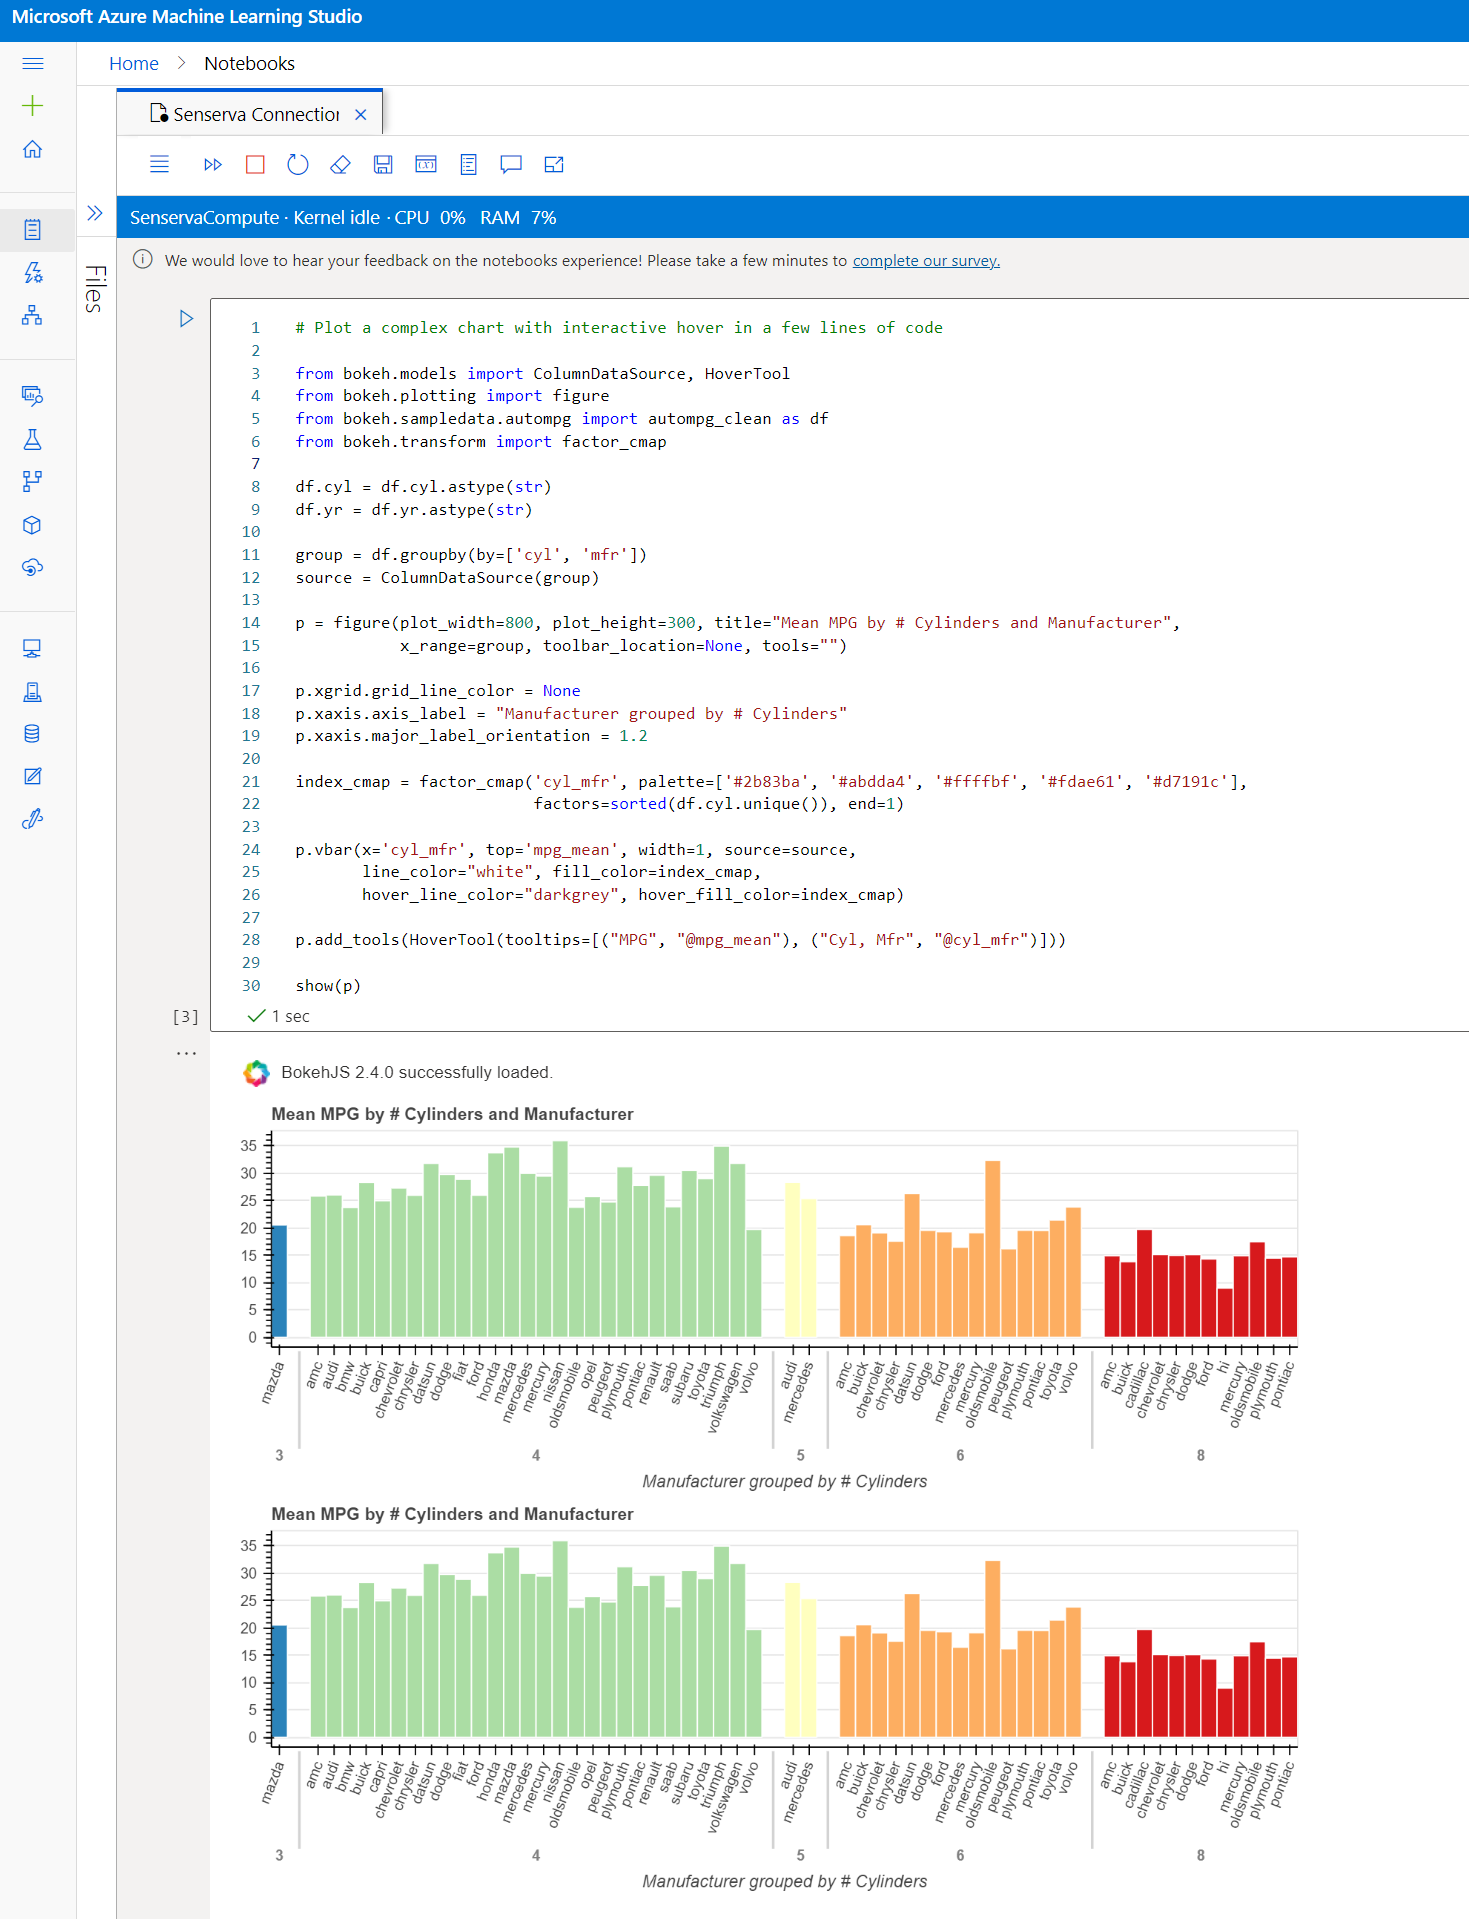
These are samples from the [Bokeh Jupyter Notebooks samples](https://hub.gke2.mybinder.org/user/bokeh-bokeh-notebooks-385m2jz1/notebooks/tutorial/00%20-%20Introduction%20and%20Setup.ipynb). I have tried restarting my compute and switching to a different compute, but see the same result
```
from bokeh.io import output_notebook, show
output_notebook()
```
```
# Plot a complex chart with interactive hover in a few lines of code
from bokeh.models import ColumnDataSource, HoverTool
from bokeh.plotting import figure
from bokeh.sampledata.autompg import autompg_clean as df
from bokeh.transform import factor_cmap
df.cyl = df.cyl.astype(str)
df.yr = df.yr.astype(str)
group = df.groupby(by=['cyl', 'mfr'])
source = ColumnDataSource(group)
p = figure(plot_width=800, plot_height=300, title="Mean MPG by # Cylinders and Manufacturer",
x_range=group, toolbar_location=None, tools="")
p.xgrid.grid_line_color = None
p.xaxis.axis_label = "Manufacturer grouped by # Cylinders"
p.xaxis.major_label_orientation = 1.2
index_cmap = factor_cmap('cyl_mfr', palette=['#2b83ba', '#abdda4', '#ffffbf', '#fdae61', '#d7191c'],
factors=sorted(df.cyl.unique()), end=1)
p.vbar(x='cyl_mfr', top='mpg_mean', width=1, source=source,
line_color="white", fill_color=index_cmap,
hover_line_color="darkgrey", hover_fill_color=index_cmap)
p.add_tools(HoverTool(tooltips=[("MPG", "@mpg_mean"), ("Cyl, Mfr", "@cyl_mfr")]))
show(p)
```
贡献指南
这个仓库没有索引到贡献指南
评估
这个 Issue 还没有评估数据。