Wrong display table (TabbedOutputContainer)
- Dominant language
- Jupyter Notebook
- Stars
- 2.9k
- Forks
- 383
- PR merge metrics
- No merged PRs in 30d
Description
This bug reproduced for Python kernel.
code for reproduce:
```
from beakerx import *
rates = pd.read_csv("../resources/data/interest-rates.csv")
c = Color(120, 120, 120, 100)
plot1 = Plot(initWidth= 300, initHeight= 400)
plot1.add(Points(x= rates.y1, y=rates.y30, size= 3, displayName="y1 vs y30"))
plot1.add(Points(x= rates.m3, y=rates.y5, size= 3, displayName="m3 vs y5"))
plot1.add(Line(x= rates.y1, y=rates.y30, color= c))
plot1.add(Line(x= rates.m3, y=rates.y5, color= c))
plot1.setShowLegend(False)
plot2 = SimpleTimePlot(rates, ["m3", "y1"], showLegend=False, initWidth= 300, initHeight= 400)
plot3 = SimpleTimePlot(rates, ["y5", "y10"], showLegend=False, initWidth= 300, initHeight= 400)
l = TabbedOutputContainerLayoutManager()
l.setBorderDisplayed(False)
o = OutputContainer()
o.setLayoutManager(l)
o.addItem(plot1, "Scatter with History")
o.addItem(plot2, "Short Term")
o.addItem(plot3, "Long Term")
o.addItem(rates, "1990/01")
o
```
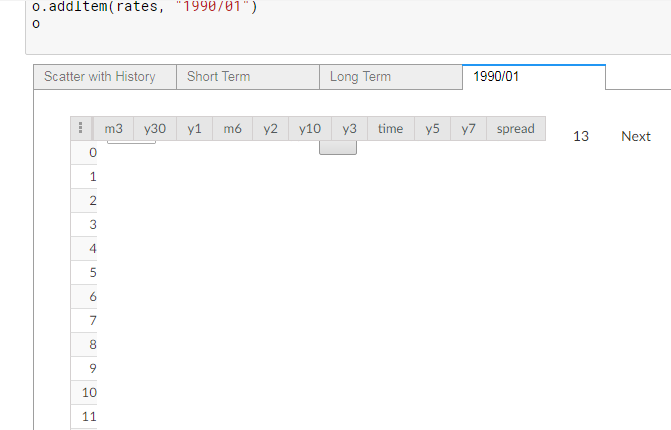
open tab with table:
Contributor guide
No contributing guide indexed for this repository
Assessment
This issue has not been assessed yet.