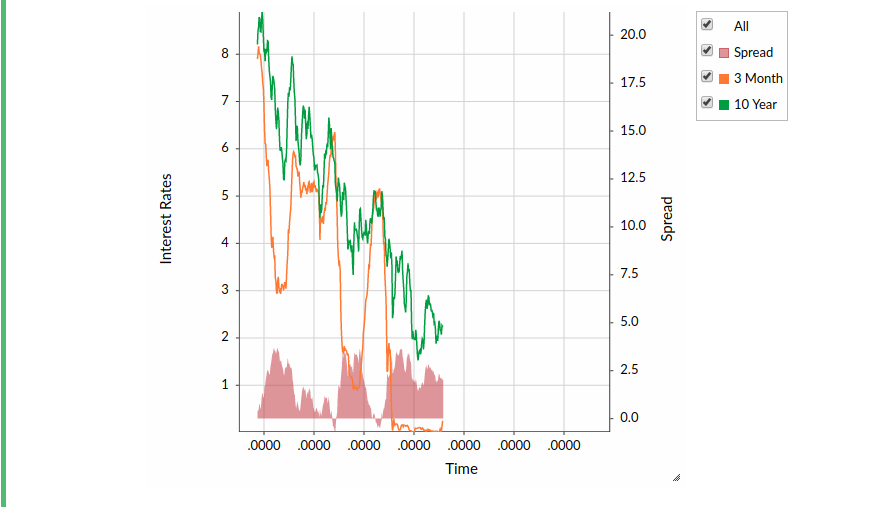
TimePlot with xMargin total greater or equal 1
- Dominant language
- Jupyter Notebook
- Stars
- 2.9k
- Forks
- 383
- PR merge metrics
- No merged PRs in 30d
Description
I found out that when you run:
```js
def p = new TimePlot(xLabel: "Time", yLabel: "Interest Rates",
xLowerMargin: 0.1, xUpperMargin: 0.9)
p << new YAxis(label: "Spread", upperMargin: 4)
p << new Area(x: rates.time, y: rates.spread, displayName: "Spread",
yAxis: "Spread", color: new Color(180, 50, 50, 128))
p << new Line(x: rates.time, y: rates.m3, displayName: "3 Month")
p << new Line(x: rates.time, y: rates.y10, displayName: "10 Year")
```
Labels on XAxis are broken.
Problem apears only when `xLowerMargin + xUpperMargin >= 1.0`
Contributor guide
No contributing guide indexed for this repository
Assessment
This issue has not been assessed yet.