thingsboard / thingsboard/thingsboard
[Feature Request] show alarms on graphs
@mykhailokornieiev is already working on this.
Since May 26, 2026.
- Dominant language
- Java
- Stars
- 22.4k
- Forks
- 6.5k
- Avg merge
- 18h 26m
- Merged PRs (30d)
- 37
Description
Hello
this is an important feature request. It is available in other iot platforms but not in thingsboard, also we find ourselves doing this custom since it is not available.
feature:
Display related/selected alarms on graphs.
purpose:
to give a visual timeline representation of alarms with the context of the data key and threshold that produced them.
- In timeseries / bar / state graph, allow to select /dynamically configure alert type to display on graph.
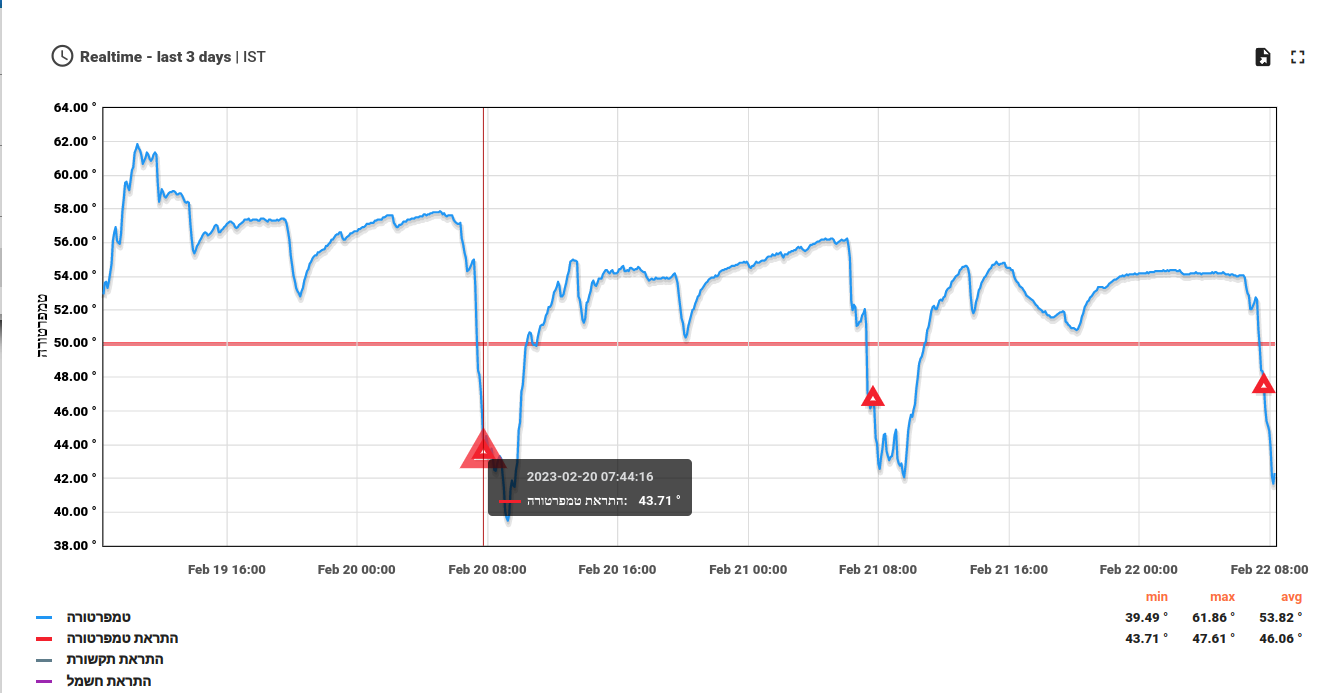
- Display alarm events on graph as Icons with different colors (can be show Active event only, show both active and clear events with same icon but different colors).
- Each alert type can have different icons on graph.
- Alert icon is shown in the data point that triggered it. For example temperature alert, at 30C, that's where the alert icon is shown on the graph.
- In the future, when you add Alarm comments, those will be displayed in the tool tip
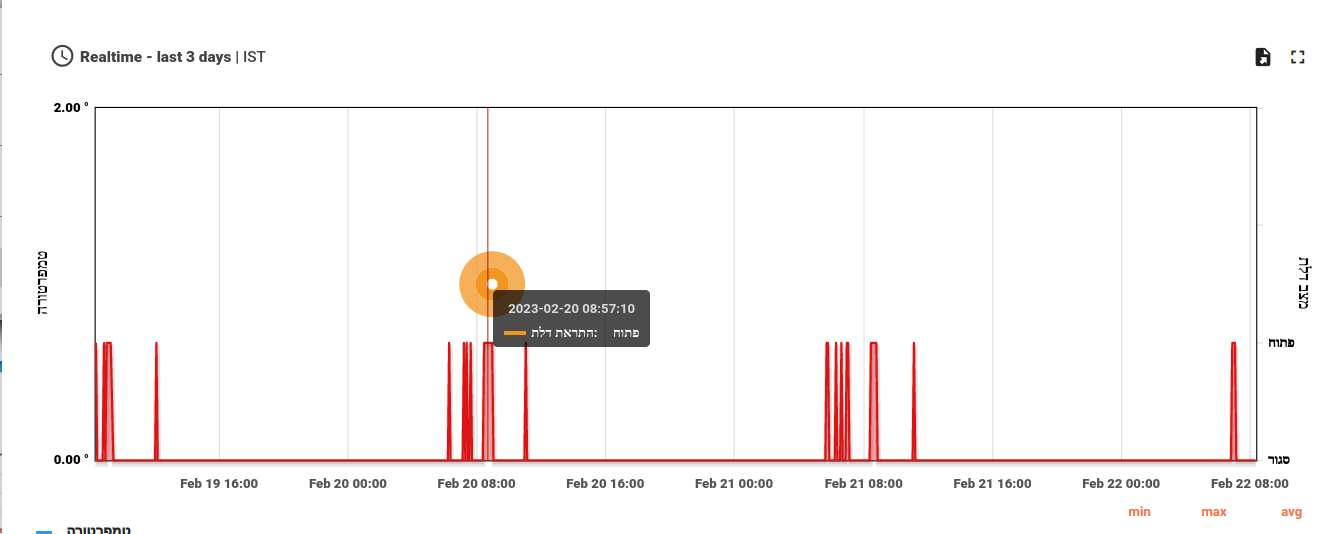
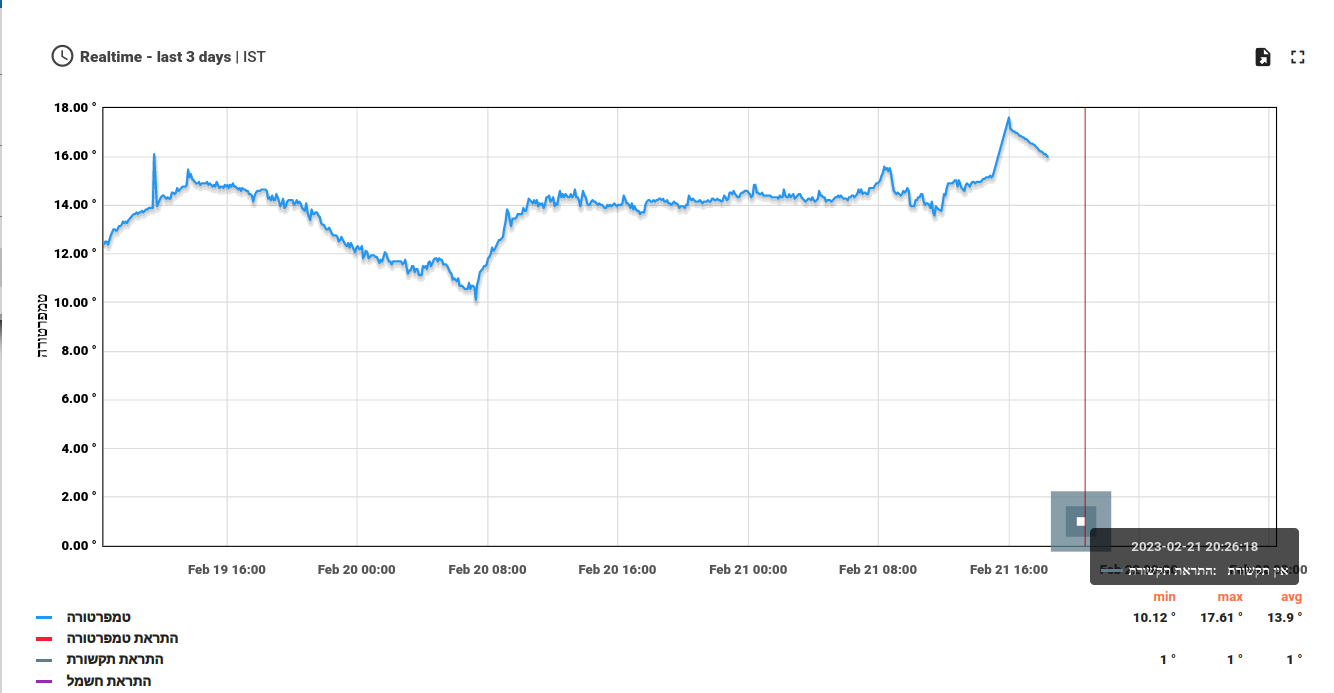
here is an example of how we do it today with custom rule chains:
here is an open door alert
and here is a temperature alert on a graph:
and here is a no comm alert on graph
@ashvayka you guys are asking what features to add to the platform, here's a good one :)
Contributor guide
No contributing guide indexed for this repository
First steps
- Read the whole issue, then the project's contributing guide.
- Comment on the issue to say you are picking it up — it saves two people doing the same work.
- Fork the repository and make your change on a branch.
- Open a pull request that references the issue number.
Assessment
This issue has not been assessed yet.