tensorflow / tensorflow/tensorboard
Execution times seem to be only CPU times, accelerator times are ignored
Nobody has claimed this yet.
- Dominant language
- TypeScript
- Stars
- 7.2k
- Forks
- 1.7k
- Avg merge
- 4d 22h
- Merged PRs (30d)
- 1
Description
- TensorBoard version: 1.13.1
- OS Platform and version: Ubuntu 18.04
- Python version: 3.6
The following example code runs a simple graph on the GPU and records run metadata for a single run. It then writes the metadata to a logdir and uses it to generate profile info:
from datetime import datetime
import numpy as np
import tensorflow as tf

shape = (1024, 48, 48, 3)
input_img = np.ones(shape=shape, dtype=np.float32)
img = tf.placeholder(dtype=tf.float32, shape=shape)
out = tf.nn.conv2d(img, tf.ones(shape=(3, 3, shape[-1], 128)), [1, 1, 1, 1], 'SAME')

with tf.Session(config=tf.ConfigProto(gpu_options=tf.GPUOptions(allow_growth=True))) as sess:
    for _ in range(10): sess.run([out], {img: input_img}) # warm up before profiling
    profiler = tf.profiler.Profiler(sess.graph)
    writer = tf.summary.FileWriter('tensorboard_bug/{}'.format(datetime.now()), sess.graph)
    run_metadata = tf.RunMetadata()
    sess.run([out], {img: input_img}, tf.RunOptions(trace_level=tf.RunOptions.FULL_TRACE), run_metadata)
    writer.add_run_metadata(run_metadata, 'step0', 0)
    profiler.add_step(0, run_metadata)
    profiler.profile_name_scope(tf.profiler.ProfileOptionBuilder().build())
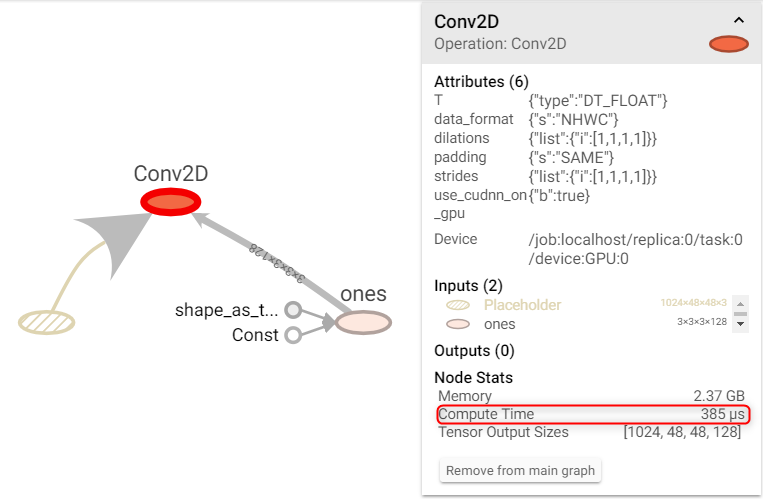
My expectation is that the timings in the profile match exactly. However, there is a huge discrepancy. It seems that tensorboard completely ignores the GPU computation time...
This is the profiler output:
Profile:
node name | total execution time | accelerator execution time | cpu execution time
_TFProfRoot (--/14.42ms, --/14.03ms, --/396us)
  Conv2D (14.39ms/14.39ms, 14.03ms/14.03ms, 369us/369us)
  Placeholder (0us/0us, 0us/0us, 0us/0us)
  _arg_Placeholder_0_0 (7us/7us, 0us/0us, 7us/7us)
  _retval_Conv2D_0_0 (3us/3us, 0us/0us, 3us/3us)
  edge_6__arg_Placeholder_0_0 (0us/0us, 0us/0us, 0us/0us)
  edge_7_Conv2D (0us/0us, 0us/0us, 0us/0us)
  ones (17us/17us, 0us/0us, 17us/17us)
    ones/Const (0us/0us, 0us/0us, 0us/0us)
    ones/shape_as_tensor (0us/0us, 0us/0us, 0us/0us)
and this is the corresponding info in tensorboard:
Contributor guide
First steps
- Read the whole issue, then the project's contributing guide.
- Comment on the issue to say you are picking it up — it saves two people doing the same work.
- Fork the repository and make your change on a branch.
- Open a pull request that references the issue number.
Research direction
Reproduce the discrepancy with the provided Python snippet, focusing on profiler.profile_name_scope, profiler output, and the TensorBoard profile view. Trace how the recorded accelerator execution time is represented in the profile and make the displayed timings agree with the profiler output.
Written by the indexing model from the issue text.
Assessment
- Tech stack
- python
- Domain
- performance
- Issue type
- Bug
- Difficulty
- 4/5
- Estimated time
- 3-5 days
- Activity status
- Stale
- Clarity
- Mostly clear
- Newbie friendliness
- 28/100