tensorflow / tensorflow/tensorboard
Plugin What-If tool: partial dep plot y-range not dynamic
@jameswex is already working on this.
Since Oct 22, 2018.
- Dominant language
- TypeScript
- Stars
- 7.2k
- Forks
- 1.7k
- Avg merge
- 4d 22h
- Merged PRs (30d)
- 1
Description
Context:
- TensorBoard master commit
728db3ef3442795a671c80f4a6a76bf1a0914d61
Description:
When using the partial dependence plots in the What-If plugin, the y-axis range of the plots is not dynamic. For example, in my case, the inference score varies from 0.0 to 0.04 (relating to some event probability). However, the y-axis range is fixed to a range of [0.0,1.0], making it very difficult to gauge the feature dependences visually (see below).
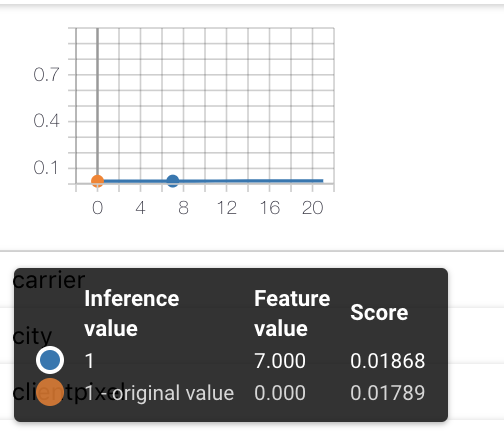
I'm talking about https://github.com/tensorflow/tensorboard/blob/7b0cc57c32915a8994c51ee7fc377a57108fea99/tensorboard/plugins/interactive_inference/tf_interactive_inference_dashboard/tf-interactive-inference-dashboard.html#L3495-L3497 specifically. I guess this might not be a bug but intended, however it does not fit a use case where the estimated probabilities are in a subset of [0,1] (e.g., 0-0.04] in my case.
Contributor guide
First steps
- Read the whole issue, then the project's contributing guide.
- Comment on the issue to say you are picking it up — it saves two people doing the same work.
- Fork the repository and make your change on a branch.
- Open a pull request that references the issue number.
Assessment
This issue has not been assessed yet.