tensorflow / tensorflow/probability
Strange/wrong sampler behavior for a variety of distributions
Nobody has claimed this yet.
- Dominant language
- Jupyter Notebook
- Stars
- 4.4k
- Forks
- 1.1k
- PR merge metrics
- No merged PRs in 30d
Description
Python version 3.8.0
Tensorflow version 2.5.0
Tensorflow-probability version 0.13.0
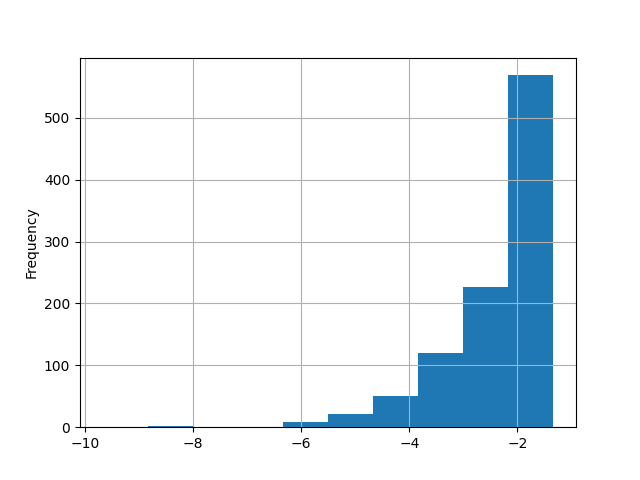
Histogram of sampled data probabilites for n=2
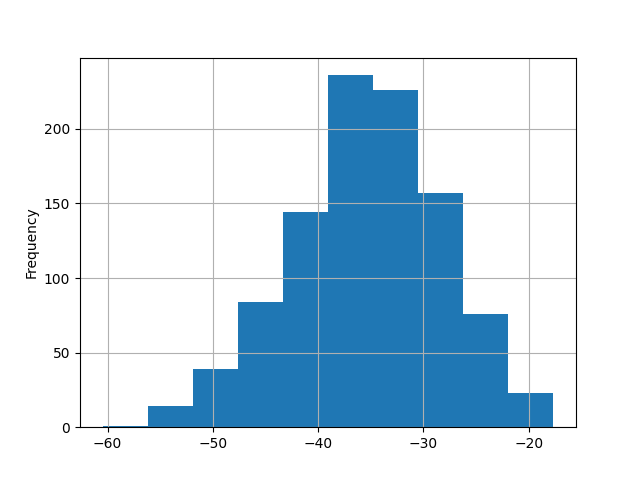
Histogram of sampled data probabilities for n=100
sampler_test_python_script.txt
Hi,
The code I attach is based on Gaussian Process Regression in TensorFlow Probability Tutorial (https://github.com/tensorflow/probability/blob/main/tensorflow_probability/examples/jupyter_notebooks/Gaussian_Process_Regression_In_TFP.ipynb). The issue I have encountered is not with the tutorial, the tutorial works fine. I am trying to do a simple sanity check on the data sampler for a distribution. The behavior that I observed happens even for basic Gaussian, which is used in the code. I build multivariate Gaussian, just like in the tutorial, and then sample from it many times (using .sample() function), each time recording the probability of the sampled data (using .log_prob() function). Then I plot the histogram of the probabilities of the samples, expecting to get samples with higher probability more often. That does indeed happen, but only for n = 2 (n being the number of variables in the multivariate distribution). As n is increased (and for any decent GP regression you need much more than 2), the most often sample data starts to drift to lower probabilities. There is something wrong with either .sample() function, or .log_prob() function, or the whole distribution package. There is also a probability that I am doing something wrong. In that case, the interface is counter intuitive. And I tried a few things, like sampling a bunch of samples at a time rather than one by one, with the same result. The histogram plots and the code are attached.
Thank you for your help,
Svetlana.
Contributor guide
First steps
- Read the whole issue, then the project's contributing guide.
- Comment on the issue to say you are picking it up — it saves two people doing the same work.
- Fork the repository and make your change on a branch.
- Open a pull request that references the issue number.
Research direction
Start with sampler_test_python_script.txt and the Gaussian_Process_Regression_In_TFP.ipynb tutorial referenced in the issue. Reproduce the .sample() and .log_prob() histograms for n=2 and n=100, then inspect whether the behavior is in the sampler, log-probability calculation, or usage. Done means documenting the cause and confirming whether a TensorFlow Probability change is needed.
Written by the indexing model from the issue text.
Assessment
- Tech stack
- jupyter-notebook, python, tensorflow
- Domain
- machine-learning
- Issue type
- Bug
- Difficulty
- 4/5
- Estimated time
- 3-5 days
- Activity status
- Stale
- Clarity
- Needs clarification
- Newbie friendliness
- 28/100