x-labels missing from 1D plot
Nobody has claimed this yet.
Assessment
- Difficulty
- 3/5
- Estimated time
- 1-2 days
- Newbie friendliness
- 38/100
- Issue type
- Bug
- Clarity
- Mostly clear
- Activity status
- Stale
- Tech stack
- matplotlib, numpy, python
- Domain
- data-visualization
Research direction
Run the supplied NDCube example and confirm that my_cube[0, 0, :].plot() produces a 1D plot without x-labels. Start at the NDCube plot entry point and trace how the sliced WCS is used for axis labels. Done means the reproduced 1D plot displays the expected x-axis labels.
Written by the indexing model from the issue text.
Description
The code below produces a 1D plot that has no x-labels (on NDCube master)
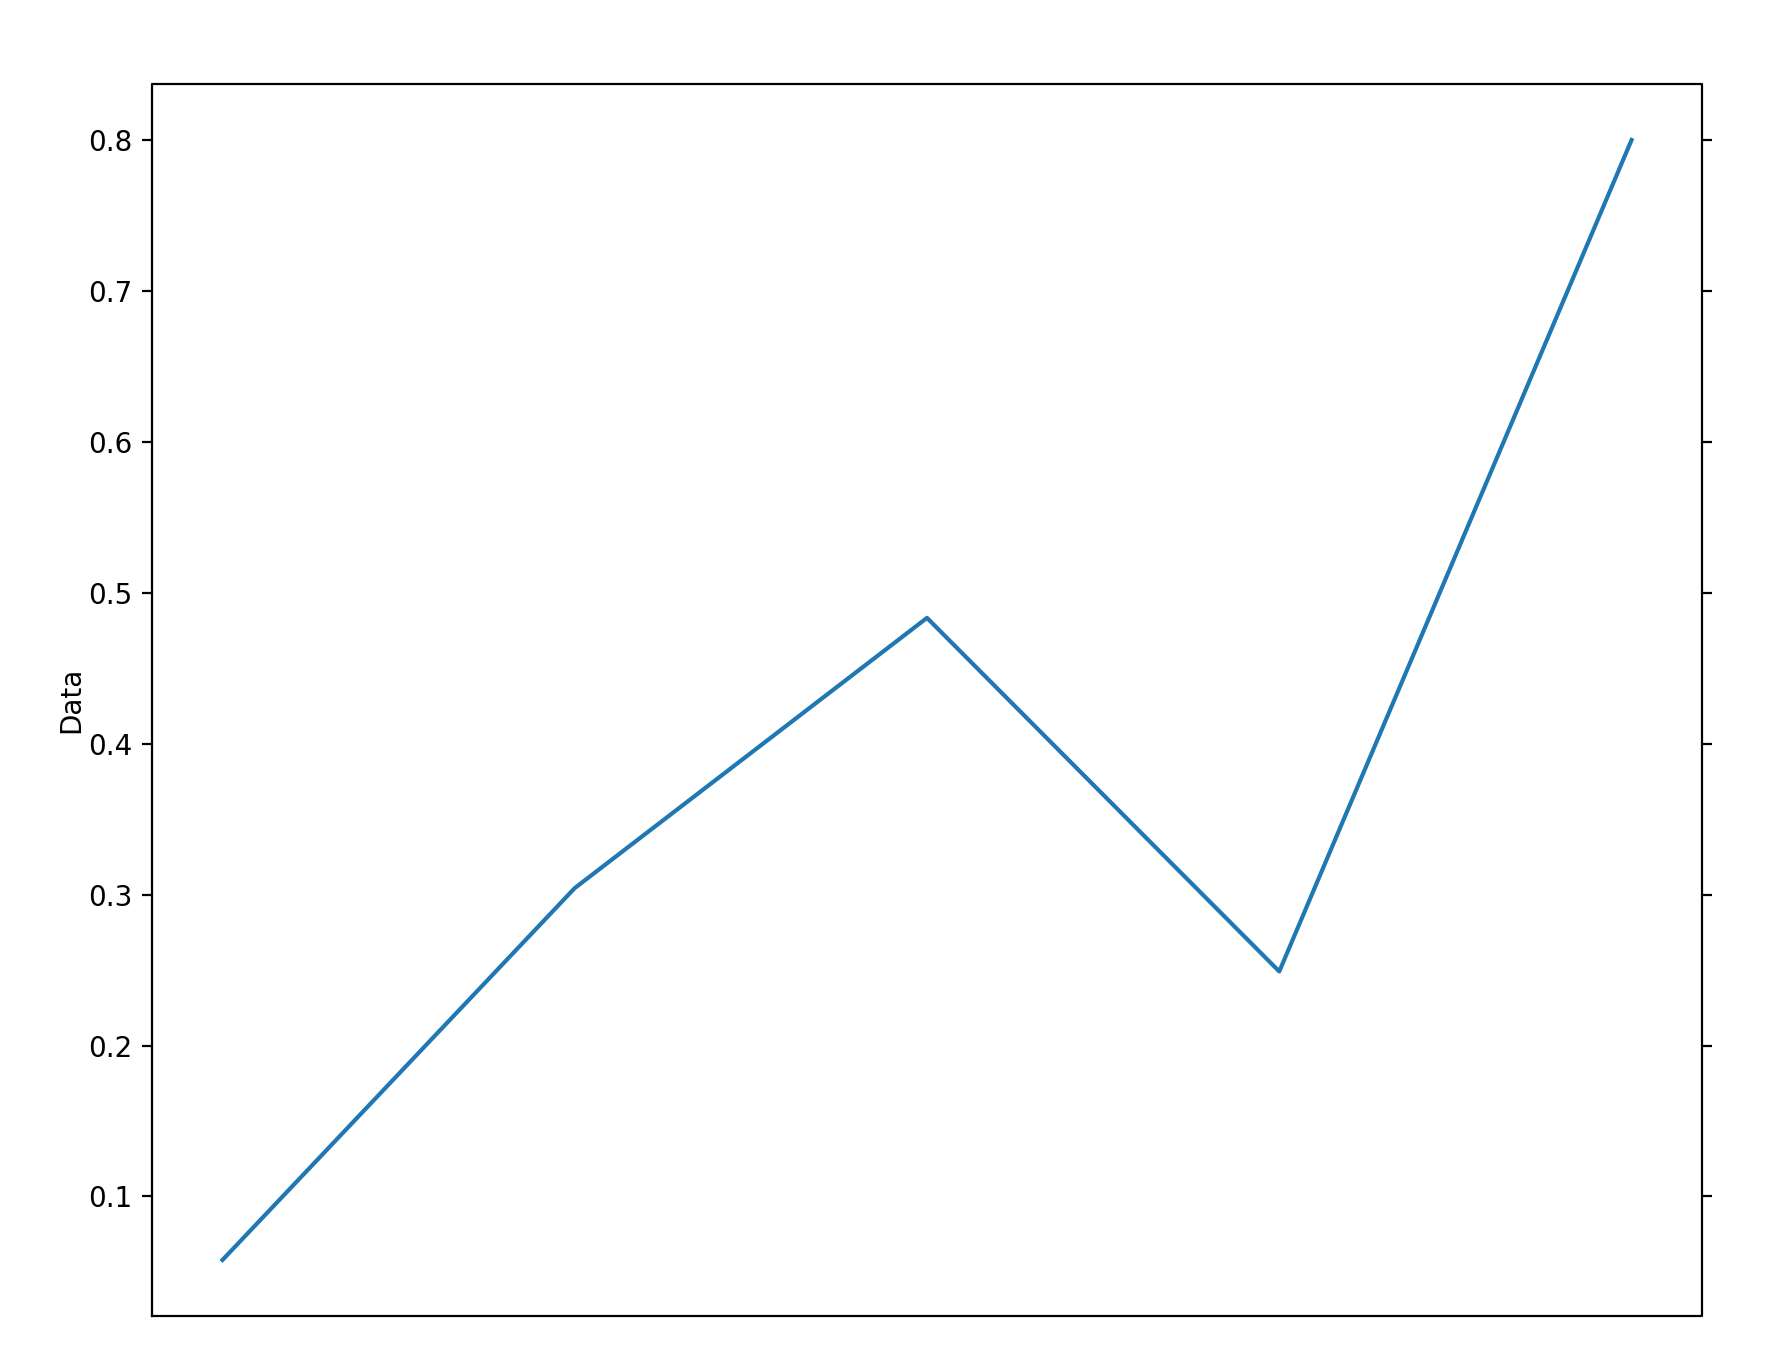
import astropy.wcs
import numpy as np

from ndcube import NDCube

# Define data array.
data = np.random.rand(4, 4, 5)
# Define WCS transformations in an astropy WCS object.
wcs = astropy.wcs.WCS(naxis=3)
wcs.wcs.ctype = 'WAVE', 'HPLT-TAN', 'HPLN-TAN'
wcs.wcs.cunit = 'Angstrom', 'deg', 'deg'
wcs.wcs.cdelt = 0.2, 0.5, 0.4
wcs.wcs.crpix = 0, 2, 2
wcs.wcs.crval = 10, 0.5, 1

# Now instantiate the NDCube
my_cube = NDCube(data, wcs=wcs)

import matplotlib.pyplot as plt
my_cube[0, 0, :].plot()
plt.show()
- Dominant language
- Python
- Stars
- 49
- Forks
- 56
- Avg merge
- 5h 54m
- Merged PRs (30d)
- 9
Contributor guide
First steps
- Read the whole issue, then the project's contributing guide.
- Comment on the issue to say you are picking it up — it saves two people doing the same work.
- Fork the repository and make your change on a branch.
- Open a pull request that references the issue number.
More from sunpy/ndcube
-
Bug
Difficulty 4/5 3-5 days Newbie friendliness 38/100
-
Bug
Difficulty 3/5 1-2 days Newbie friendliness 45/100
-
Feature Request
Difficulty 3/5 1-2 days Newbie friendliness 35/100
-
Difficulty 5/5 Over a week Newbie friendliness 25/100
-
Feature Request
Difficulty 4/5 3-5 days Newbie friendliness 42/100
Similar issues
-
Difficulty 2/5 1-3 hours Newbie friendliness 74/100
bancolombia/sentinel#23 ·
-
test md OpenCI
Difficulty 2/5 1-3 hours Newbie friendliness 74/100
-
integration:quickjs org:external priority:backlog topic:code-interpreter topic:middleware type:feature
Difficulty 2/5 1-3 hours Newbie friendliness 74/100
langchain-ai/deepagents#6450 ·
-
bug client
Difficulty 2/5 1-3 hours Newbie friendliness 88/100
-
Difficulty 2/5 1-3 hours Newbie friendliness 74/100