suggestion for CompareMeans when passing DataFrame
Nobody has claimed this yet.
Assessment
- Difficulty
- 5/5
- Estimated time
- Over a week
- Newbie friendliness
- 25/100
Research direction
Start at statsmodels.stats.weightstats.CompareMeans.from_data, using the DataFrame examples in the issue to inspect how column names and column order affect the inputs. Clarify the intended handling of DataFrame versus Series data and whether grouped summaries for multiple columns are in scope; done should mean the behavior and requested interface are defined and covered appropriately.
Written by the indexing model from the issue text.
Description
I was exposed to using .from_data() classmethod to return a CompareMeans object in https://github.com/statsmodels/statsmodels/issues/4774 .
The example @adrienpacifico provided:
import pandas as pd
import statsmodels.stats

df1 = pd.DataFrame({"Age": [21,23,54], 'Income': [200, 150,600]})
df2 = pd.DataFrame({"Age": [30,26,34], 'Income': [400, 250,100]})

print(statsmodels.stats.weightstats.CompareMeans.from_data(df1,df2).summary())
Output
                          Test for equality of means
==============================================================================
                 coef    std err          t      P>|t|      [0.025      0.975]
------------------------------------------------------------------------------
subset #1      2.6667     10.929      0.244      0.819     -27.677      33.011
subset #2     66.6667    166.667      0.400      0.710    -396.074     529.408
==============================================================================
Instead of the column name issue mentioned by @josef-pkt. I would strongly suggest to rethink of the input dtype of this classmethod. By all means, unlike numpy array, passing two DataFrame could be very confusing due to the existence of column name, which gives meanings to the underlying data.
I could literately change the name of the columns in both dataframe to whatever I want and then get the exact same result.
import pandas as pd
import statsmodels.stats.api as sms

df1 = pd.DataFrame({'a': [21,23,54], 'b': [200, 150,600]})
df2 = pd.DataFrame({'c': [30,26,34], 'd': [400, 250,100]})
print(sms.CompareMeans.from_data(df1, df2).summary())

# Test for equality of means
==============================================================================
                 coef    std err          t      P>|t|      [0.025      0.975]
------------------------------------------------------------------------------
subset #1      2.6667     10.929      0.244      0.819     -27.677      33.011
subset #2     66.6667    166.667      0.400      0.710    -396.074     529.408
==============================================================================
The output will vary if I change the postion of the columns in the dataframe like the following:
df1 = pd.DataFrame({'a': [21,23,54], 'b': [200, 150,600]})
df2 = pd.DataFrame({'d': [400, 250,100], 'c': [30,26,34]})
print(sms.CompareMeans.from_data(df1, df2).summary())

# Test for equality of means
==============================================================================
                 coef    std err          t      P>|t|      [0.025      0.975]
------------------------------------------------------------------------------
subset #1   -217.3333     87.259     -2.491      0.067    -459.603      24.936
subset #2    286.6667    142.419      2.013      0.114    -108.751     682.085
==============================================================================
However, before and after the change, there is no difference of the data stored in df2. I would say both of the outputs are meaningless since we don't know what the connection between those two dataframe is. In the real word, we mainly dealing with dataframe in a tidy format. I think StatsModels as a statistical analysis package shouldn't worry about this formatting issue like column names but require its users to do any necessary data tidying before using it. The above two dataframe should be merged as df like the following with a new column to idenfy group informaion.
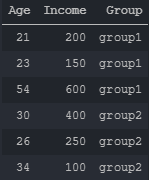
And then use .loc to index data and pass them to sms.CompareMeans()
group1 = df.loc[df.Group == 'group1', 'Age']
group2 = df.loc[df.Group == 'group2', 'Age']
cm = sms.CompareMeans.from_data(group1, group2)
print(cm.summary())

# Test for equality of means
==============================================================================
                 coef    std err          t      P>|t|      [0.025      0.975]
------------------------------------------------------------------------------
subset #1      2.6667     10.929      0.244      0.819     -27.677      33.011
==============================================================================
I wish there could be a function that could automatically return the summary for both Age and Income columns. I can simply pass the name of the dataframe, list of columns storing data, and the column with group label.
- Dominant language
- Python
- Stars
- 11.6k
- Forks
- 3.6k
- Avg merge
- 7h 37m
- Merged PRs (30d)
- 96
Contributor guide
First steps
- Read the whole issue, then the project's contributing guide.
- Comment on the issue to say you are picking it up — it saves two people doing the same work.
- Fork the repository and make your change on a branch.
- Open a pull request that references the issue number.
More from statsmodels/statsmodels
-
Difficulty 1/5 Under an hour Newbie friendliness 90/100
statsmodels/statsmodels#10271 ·
-
type-bug
Difficulty 2/5 1-3 hours Newbie friendliness 78/100
statsmodels/statsmodels#10269 ·
-
Documentation
Difficulty 2/5 1-3 hours Newbie friendliness 92/100
statsmodels/statsmodels#10266 ·
-
Difficulty 1/5 Under an hour Newbie friendliness 78/100
statsmodels/statsmodels#9627 · 1 comment ·
-
Difficulty 2/5 1-3 hours Newbie friendliness 62/100
statsmodels/statsmodels#9293 · 1 comment ·
All issues in statsmodels/statsmodels
Similar issues
-
Difficulty 2/5 1-3 hours Newbie friendliness 74/100
bancolombia/sentinel#23 ·
-
test md OpenCI
Difficulty 2/5 1-3 hours Newbie friendliness 74/100
-
integration:quickjs org:external priority:backlog topic:code-interpreter topic:middleware type:feature
Difficulty 2/5 1-3 hours Newbie friendliness 74/100
langchain-ai/deepagents#6450 ·
-
bug client
Difficulty 2/5 1-3 hours Newbie friendliness 88/100
-
Difficulty 2/5 1-3 hours Newbie friendliness 74/100