R fatal error when calling pairs
Nobody has claimed this yet.
- Dominant language
- R
- Stars
- 1.1k
- Forks
- 266
- Avg merge
- 2h 56m
- Merged PRs (30d)
- 1
Description
Summary:
Calling pairs() on two different models has resulted in 2 R fatal errors/R sessions aborted.
Description:
I created the models with brm() in the BRMS package. I received warnings that there were many (~200) divergent transitions with the first model that crashed and just 1 divergent transition the second time it crashed. I have successfully run the pairs() function once but there were no red dots in it which I expected based on my reading of what the pairs() function does. The other time I managed to get a plot, the plot was broken.
Reproducible Steps:
Here is the data I used:
SampleData.xlsx
And the code I used for the second time it crashed:
prior<-get_prior(formula = bf(value ~ 1 + allowed_vote + (1|Participant) + (1|variable))+
    lf(disc ~ 0 + allowed_vote, cmc = FALSE),
  data = data,
  family = acat("probit"))

fit_G3_withPriors<-brm(
  formula = bf(value ~ 1 + allowed_vote + (1|Participant) + (1|variable))+
    lf(disc ~ 0 + allowed_vote, cmc = FALSE),
  data = data,
  family = cumulative("probit"),
  save_all_pars = TRUE,
  prior = prior
)

pairs(fit_G3_withPriors)
Current Output:
The message when crashing with a cumulative model with unequal variances: 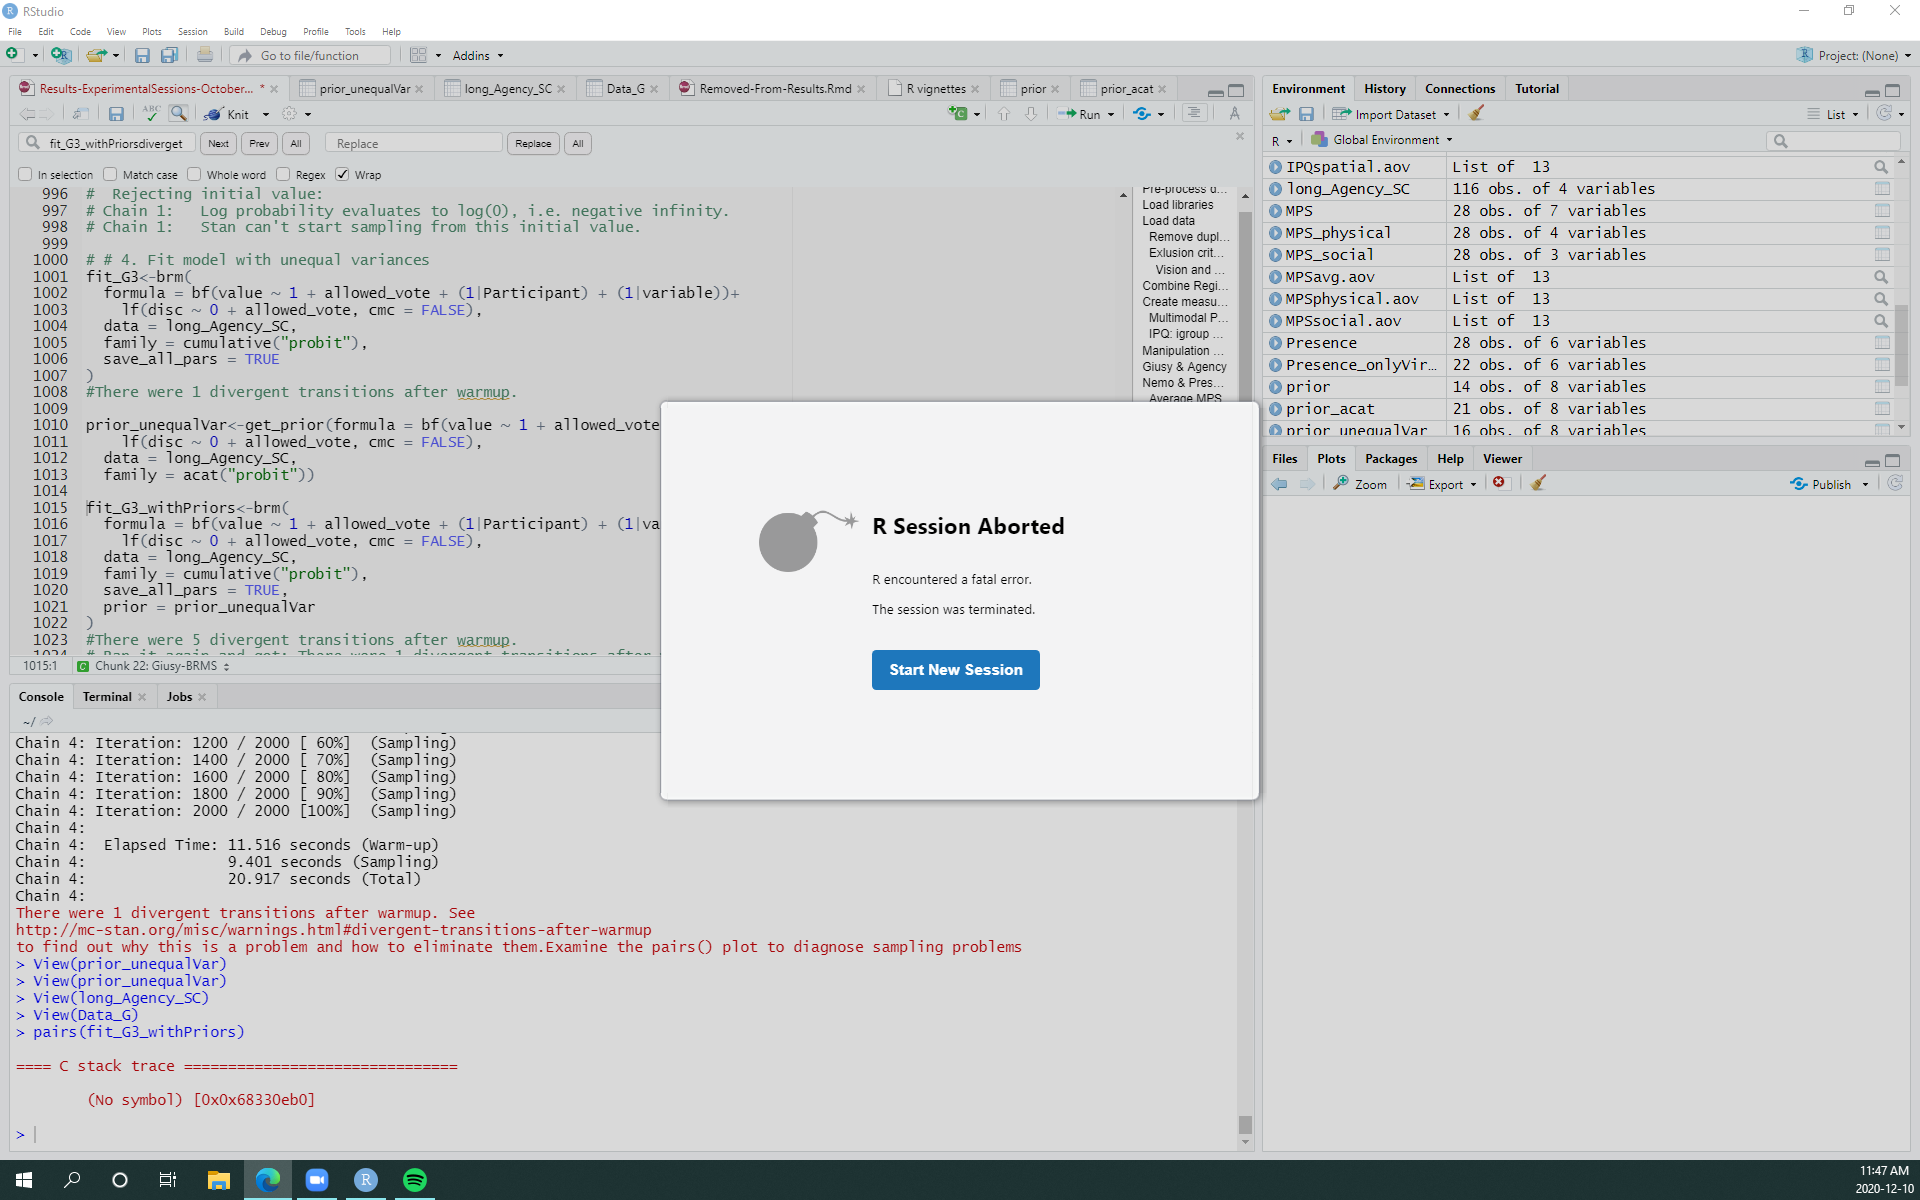
The plot I got that was clearly broken (from running adjacent category model with category-specific effects):
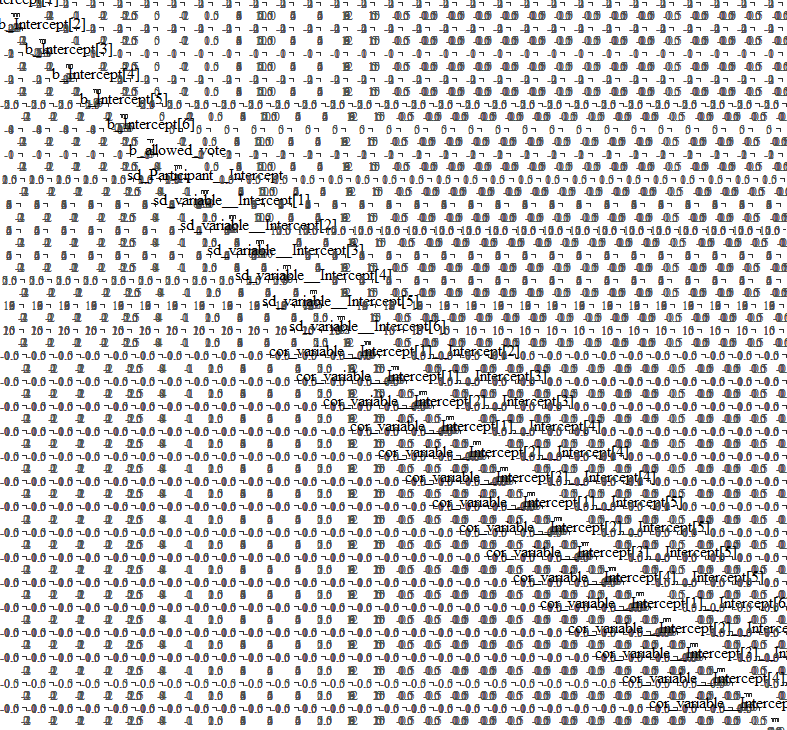
The plot I got when pairs() actually ran with a cumulative model with equal variances:

Expected Output:
The pairs plot is supposed to show divergent transitions with red points but even when pairs ran, I don't see any red points in the pairs() plot (though I believe in that case there was only one divergent transition).
Versions:
rstan_2.21.2
brms_2.13.5
R version 4.0.2
Contributor guide
No contributing guide indexed for this repository
First steps
- Read the whole issue, then the project's contributing guide.
- Comment on the issue to say you are picking it up — it saves two people doing the same work.
- Fork the repository and make your change on a branch.
- Open a pull request that references the issue number.
Research direction
Start by reproducing pairs(fit_G3_withPriors) from the supplied R code and SampleData.xlsx with the listed rstan, brms, and R versions. Inspect the pairs plotting path for the cumulative and adjacent-category models, then verify that the session no longer aborts and that divergent transitions are represented correctly in the resulting plot.
Written by the indexing model from the issue text.
Assessment
- Tech stack
- r
- Domain
- data-visualization
- Issue type
- Bug
- Difficulty
- 4/5
- Estimated time
- 3-5 days
- Activity status
- Stale
- Clarity
- Mostly clear
- Newbie friendliness
- 35/100