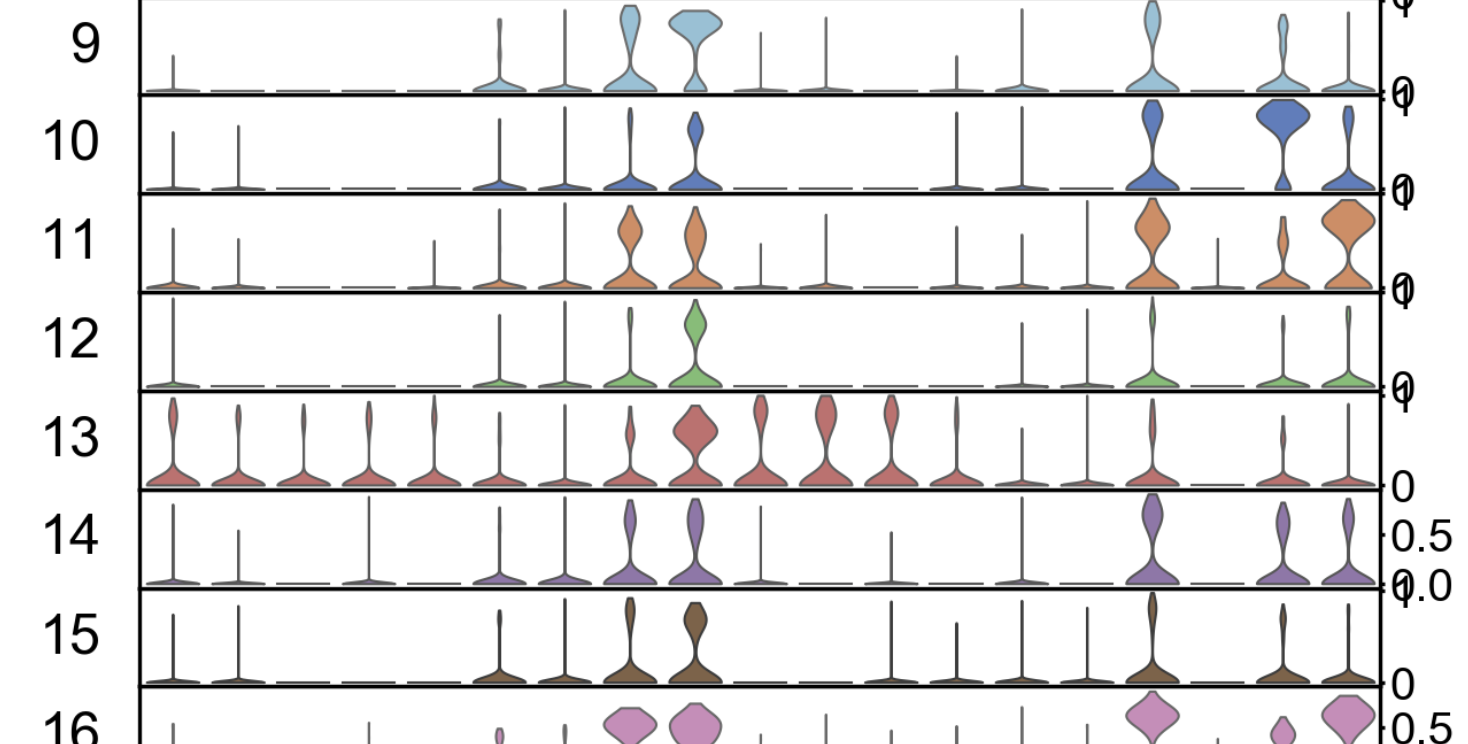
sc.pl.stacked_violin overplotting of y-axis scale
Nobody has claimed this yet.
- Dominant language
- Python
- Stars
- 2.6k
- Forks
- 779
- Avg merge
- 1d 4h
- Merged PRs (30d)
- 27
Description
Especially when using standard_scale = 'var', the scale values obscure each other if values are '0' and '1'. Is there a way to allow for off-center plotting of the scale values? Minimizing the font size helps somewhat but is far from ideal.
...
sc.settings.set_figure_params(dpi=150)
sc.pl.stacked_violin(adata, marker_genes, groupby='louvain', rotation = 90, standard_scale = 'var'
...
Output:
Versions:
<scanpy==1.4.4.post1 anndata==0.6.22.post1 umap==0.3.9 numpy==1.15.4 scipy==1.3.0 pandas==0.23.4 scikit-learn==0.20.2 statsmodels==0.10.2 python-igraph==0.7.1 louvain==0.6.1>
Contributor guide
First steps
- Read the whole issue, then the project's contributing guide.
- Comment on the issue to say you are picking it up — it saves two people doing the same work.
- Fork the repository and make your change on a branch.
- Open a pull request that references the issue number.
Research direction
Start with the minimal reproducible example using sc.pl.stacked_violin and standard_scale='var'. Inspect how the y-axis scale values are positioned and reproduce the overlap shown in the attached output. Done means the scale values remain readable without relying only on a smaller font, while preserving the stacked violin plot.
Written by the indexing model from the issue text.
Assessment
- Tech stack
- python
- Domain
- data-visualization
- Issue type
- Bug
- Difficulty
- 3/5
- Estimated time
- 1-2 days
- Activity status
- Stale
- Clarity
- Mostly clear
- Newbie friendliness
- 35/100