Show scatterplots with colorbar side-by-side
Open
@flying-sheep is already working on this.
Since Mar 16, 2020.
Area - Plotting 🌺
- Dominant language
- Python
- Stars
- 2.6k
- Forks
- 779
- Avg merge
- 1d 4h
- Merged PRs (30d)
- 27
Description
Hi,
I created scatterplots for quality control and want to show them side-by-side to save some space.
I tried it using subplots, but this is what happens:
fig, (ax1, ax2) = plt.subplots(1, 2, figsize=(15, 5))
p1 = sc.pl.scatter(adata, x='n_counts', y='n_genes', color='n_genes', show=False, ax=ax1)
p2 = sc.pl.scatter(adata[adata.obs['n_counts'] < 10000], x='n_counts', y='n_genes', color='n_genes', show=False, ax=ax2)
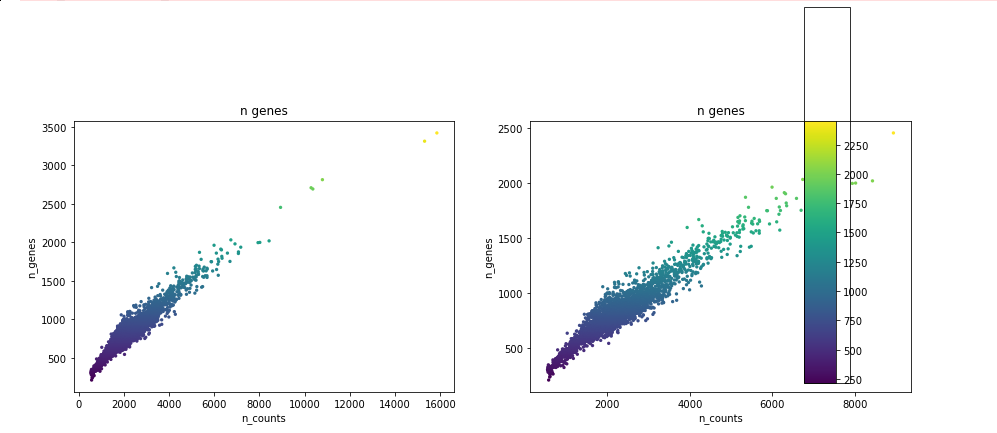
The problem seems to be that pl.scatter adds an additional axes of that subplots doesn't know anything. Is there an easy fix for that?
Versions
scanpy==1.4.4 anndata==0.6.22.post1 umap==0.3.10 numpy==1.17.1 scipy==1.3.1 pandas==0.25.1 scikit-learn==0.21.3 statsmodels==0.10.1 python-igraph==0.7.1 louvain==0.6.1
Full repex
import scanpy as sc
import numpy as np
from matplotlib import pyplot as plt

adata = sc.read_h5ad("data/pbmc3k_raw.h5ad")

adata.obs['n_counts'] = adata.X.sum(axis=1)
adata.obs['n_genes'] = (adata.X != 0).sum(axis=1)

# show plots below each other (standard, works)
p1 = sc.pl.scatter(adata, x='n_counts', y='n_genes', color='n_genes', show=False)
p2 = sc.pl.scatter(adata[adata.obs['n_counts'] < 10000], x='n_counts', y='n_genes', color='n_genes', show=False)

# try to show plots side-by-side (looks weird)
fig, (ax1, ax2) = plt.subplots(1, 2, figsize=(15, 5))
p1 = sc.pl.scatter(adata, x='n_counts', y='n_genes', color='n_genes', show=False, ax=ax1)
p2 = sc.pl.scatter(adata[adata.obs['n_counts'] < 10000], x='n_counts', y='n_genes', color='n_genes', show=False, ax=ax2)
Contributor guide
First steps
- Read the whole issue, then the project's contributing guide.
- Comment on the issue to say you are picking it up — it saves two people doing the same work.
- Fork the repository and make your change on a branch.
- Open a pull request that references the issue number.
Assessment
This issue has not been assessed yet.