Bug in diffusion map plotting in 1.9.1?
Nobody has claimed this yet.
- Dominant language
- Python
- Stars
- 2.6k
- Forks
- 779
- Avg merge
- 1d 4h
- Merged PRs (30d)
- 27
Description
- [ x] I have checked that this issue has not already been reported.
- [ x] I have confirmed this bug exists on the latest version of scanpy.
- (optional) I have confirmed this bug exists on the master branch of scanpy.
Hi!
When running sc.pl.diffmap with 1.8.2 in my object I get a nice diffusion map plot:

However, when using the same function with 1.9.1 in exactly the same object (with exactly the same 'X_diffmap') I get an awful plot:
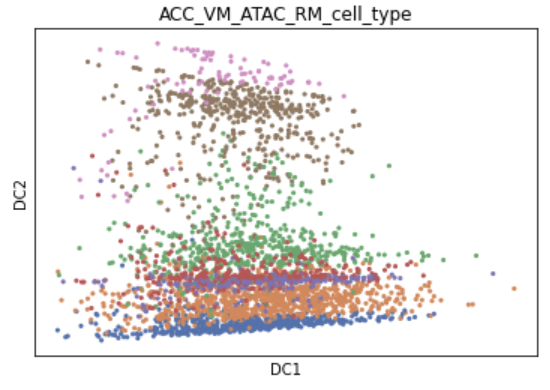
Any idea what is going on? This only affects plotting (also tried using sc.pl.embedding), the dpt function gives the same results for example.
Thanks!
C
Contributor guide
First steps
- Read the whole issue, then the project's contributing guide.
- Comment on the issue to say you are picking it up — it saves two people doing the same work.
- Fork the repository and make your change on a branch.
- Open a pull request that references the issue number.
Research direction
Start by reproducing the reported difference with sc.pl.diffmap on the same object under versions 1.8.2 and 1.9.1, then compare sc.pl.embedding as noted in the report. Done means identifying and correcting the plotting-only regression so the diffusion map renders as expected without changing the existing X_diffmap or dpt results.
Written by the indexing model from the issue text.
Assessment
- Tech stack
- python
- Domain
- data-visualization
- Issue type
- Bug
- Difficulty
- 4/5
- Estimated time
- 3-5 days
- Activity status
- Stale
- Clarity
- Mostly clear
- Newbie friendliness
- 35/100