Order of cell plotting differs in UMAP and scatterplot
Nobody has claimed this yet.
- Dominant language
- Python
- Stars
- 2.6k
- Forks
- 779
- Avg merge
- 1d 4h
- Merged PRs (30d)
- 27
Description
- [ x] I have checked that this issue has not already been reported.
- I have confirmed this bug exists on the latest version of scanpy.
- (optional) I have confirmed this bug exists on the master branch of scanpy.
Scanpy version:1.8.1
May be related to: https://github.com/theislab/scanpy/issues/1263
In some scatterplot-based plots it is possible to set custom cell order (e.g. UMAP), while it others it is not possible (e.g. scatterplot). Solution: preserve cell order in scatterplot when possible.
Reproduce:
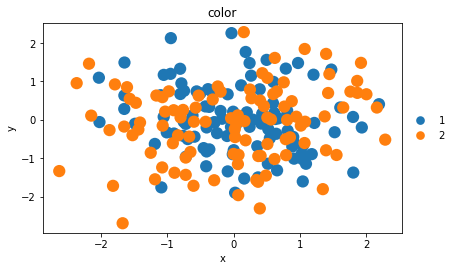
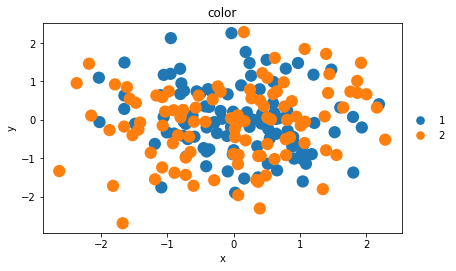
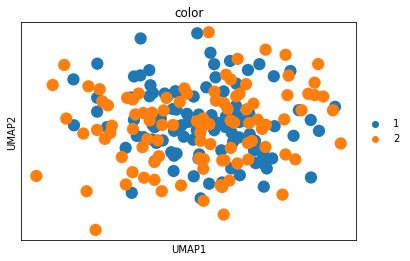
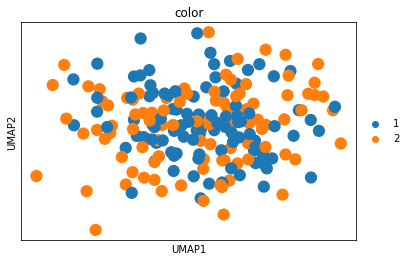
Want the class 2 not to be on class 1 - works on UMAp but not on scatterplot.
import scanpy as sc
import pandas as pd
import numpy as np

x=np.random.normal(size=200)
y=np.random.normal(size=200)
adata=sc.AnnData(obs=pd.DataFrame({'color':['1']*100+['2']*100,'x':x,'y':y}))
adata.obsm['X_umap']=np.array([x,y]).T
Scatterplot, default order
sc.pl.scatter(adata, x='x', y='y', color='color')
Scatterplot, try to set random order, not working
np.random.seed(0)
random_indices=np.random.permutation(list(range(adata.shape[0])))
sc.pl.scatter(adata[random_indices,:], x='x', y='y',   color='color')
UMAP, default order
sc.pl.umap(adata, color='color')
UMAP, try to set random order, works
np.random.seed(0)
random_indices=np.random.permutation(list(range(adata.shape[0])))
sc.pl.umap(adata[random_indices,:],   color='color')
Contributor guide
First steps
- Read the whole issue, then the project's contributing guide.
- Comment on the issue to say you are picking it up — it saves two people doing the same work.
- Fork the repository and make your change on a branch.
- Open a pull request that references the issue number.
Research direction
Start with the sc.pl.scatter and sc.pl.umap entry points and run the reproduction using the supplied AnnData and shuffled indices. Compare how each plot handles cell ordering, then verify that scatterplot preserves the supplied order when possible and matches the demonstrated UMAP behavior.
Written by the indexing model from the issue text.
Assessment
- Tech stack
- python
- Domain
- data-visualization
- Issue type
- Bug
- Difficulty
- 3/5
- Estimated time
- 1-2 days
- Activity status
- Stale
- Clarity
- Mostly clear
- Newbie friendliness
- 45/100