sc.pl.dotplot() `standard_scale='var'`: should scaling be changed?
Nobody has claimed this yet.
- Dominant language
- Python
- Stars
- 2.6k
- Forks
- 779
- Avg merge
- 1d 4h
- Merged PRs (30d)
- 27
Description
This issue references the following line of code:
The documentation accurately describes the standard_scale='var' normalization strategy as
"Whether or not to standardize the given dimension between 0 and 1, meaning for each variable or group, subtract the minimum and divide each by its maximum."
Something about this normalization has bothered me for a long time, and I finally realized: it's the subtraction of the minimum value. This subtraction means that the minimum valued dot will have color = 0. Imagine a case with only two groupby groupings: healthy and disease. In that case, one of the dots will always have color 0, and the other will have color 1. Totally binary, no matter how close the actual values are.
I feel that this kind of normalization is very misleading for scRNA-seq data!
A random example follows:
This image makes it look like these genes are very specific to one tissue or another ---------------
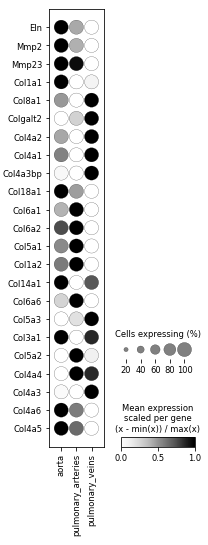
But in reality, if we had scaled by just dividing by the max (and not first subtracting the min), then we'd see -------
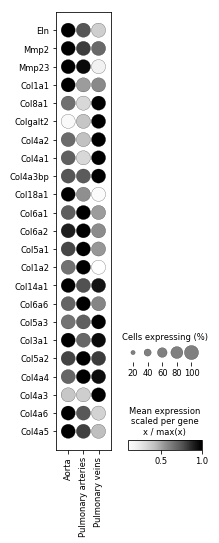
which is much more realistic, and much closer to what you'd see if you used a log-scaling instead, and made several different plots for genes expressed at different levels overall.
I leave it up for discussion, but I would suggest two types of fixes:
- delete the above line 185 (and the other places it shows up...)
- allow the user to specify a custom normalization function (but change the default to
x / max(x)instead of(x - min(x)) / max(x))
Contributor guide
First steps
- Read the whole issue, then the project's contributing guide.
- Comment on the issue to say you are picking it up — it saves two people doing the same work.
- Fork the repository and make your change on a branch.
- Open a pull request that references the issue number.
Research direction
Start at scanpy/plotting/_dotplot.py line 185 and inspect the other occurrences of the same normalization. Compare the current min-subtracted scaling with the proposed max-only behavior using the issue's examples, then review the eight-comment discussion for an agreed direction. Done means the normalization behavior and any customization scope are decided and consistently addressed.
Written by the indexing model from the issue text.
Assessment
- Tech stack
- python
- Domain
- data-visualization
- Issue type
- Feature
- Difficulty
- 5/5
- Estimated time
- Over a week
- Activity status
- Stale
- Clarity
- Mostly clear
- Newbie friendliness
- 35/100