Add a contour plot?
Nobody has claimed this yet.
- Dominant language
- Python
- Stars
- 12
- Forks
- 6
- PR merge metrics
- No merged PRs in 30d
Description
Would look like:
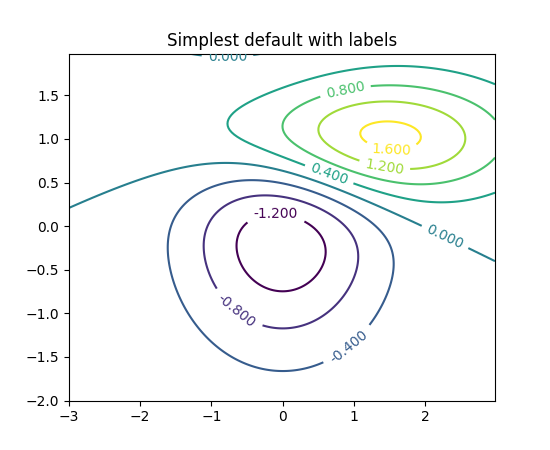
We could support both filled and non-filled contours with a kwarg?

Note: I am unsure how masks would be handled in such a plot, as unlike with an image, you cannot just make a small area of pixels with a different colormap.
Passing a numpy masked array to matplotlib's contourf is handled but often yields ugly results with 'torn' boundaries around masks.
Maybe we could just raise if the input data contains masks?
Contributor guide
First steps
- Read the whole issue, then the project's contributing guide.
- Comment on the issue to say you are picking it up — it saves two people doing the same work.
- Fork the repository and make your change on a branch.
- Open a pull request that references the issue number.
Research direction
Start by reviewing the linked contour_demo reference and matplotlib's contourf behavior, including the masked-array note in the issue. Done should support both filled and non-filled contours through a kwarg and establish how masked input is handled.
Written by the indexing model from the issue text.
Assessment
- Tech stack
- matplotlib, numpy, python
- Domain
- data-visualization
- Issue type
- Feature
- Difficulty
- 5/5
- Estimated time
- Over a week
- Activity status
- Stale
- Clarity
- Mostly clear
- Newbie friendliness
- 35/100